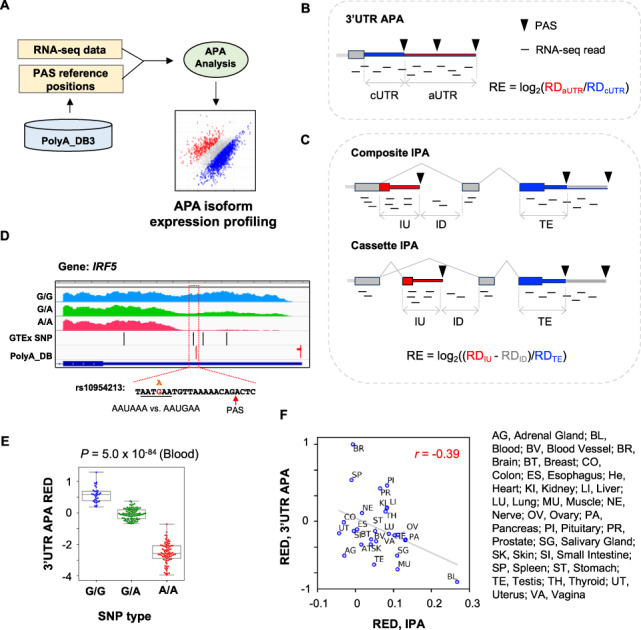
Fig. 1.

APAlyzer design and examples. (A) Overall design of APAlyzer. (B) Schematic of 3′UTR APA analysis. RE, relative expression between two APA regions; RD, read density. Constitutive regions are in blue, and alternative regions in red. (C) Schematic of IPA analysis. Two IPA types are shown, namely, composite IPA and cassette IPA. Note that only the constitutive region of the 3′ terminal exon (shown in blue) is used for calculation, avoiding complications from 3′UTR APA. (D) An example of 3′UTR APA in human IRF5 gene that is affected by an SNP. RNA-seq data are segregated by three SNP types. SNPs and PASs are indicated. The SNP rs10954213 changes the PAS signal AAUAAA, as indicated. RNA-seq data from blood samples were analyzed. (E) IRF5 3′UTR REDs for three SNP populations. RED was calculated using the median of all samples as reference. P-value was based on the Kolmogorov–Smirnov test between G/G and A/A populations. (F) Scatter plot showing correlation between 3′UTR APA REDs and IPA REDs across human tissues. REDs are REs standardized across all samples. Tissue names are indicated. 3′UTR APA REDs and IPA APA REDs across human tissues were based on the GTEx data. IPA REDs were based on composite and cassette IPA events combined (Supplementary Fig. S1B and C). (Color version of this figure is available at Bioinformatics online.)
