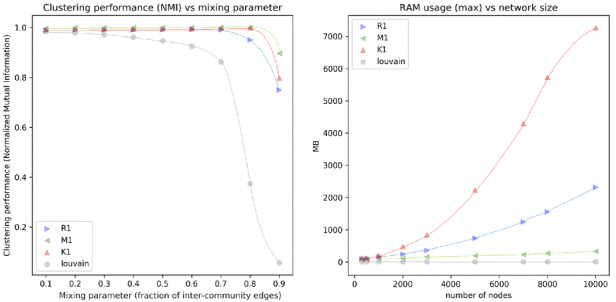
Fig. 1.

Comparison of the MONET methods (K1, M1 and R1) against a baseline (Louvain) on simulated graphs with planted community structure. On the left: clustering performance (NMI) as a function of the fraction of inter-module edges (mixing parameter). Right: memory requirements as a function of network size. Each point represents an average of the results obtained performing a grid search over the following parameter space (at least two repetitions for each combination of parameters): number of nodes: 5k, 7k, 8k, 10k; average node degree: 15, 20, 25; exponent of the distribution of community sizes: 1, 2 and exponent of the distribution of node degrees: 2, 3
