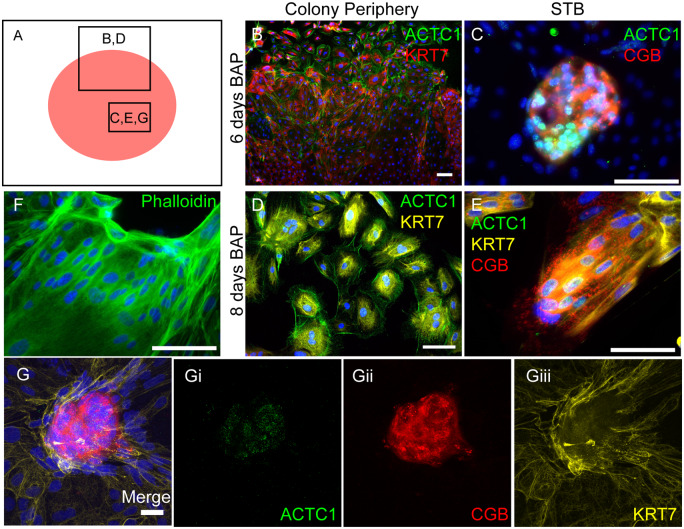
Figure 4.
Actin alpha cardiac muscle 1 (ACTC1) is expressed in 6- and 8-day treated hESCBAP. (A–E) ACTC1 is expressed in CGB+ STB in two distinct patterns. (A) The red circle represents a colony of hESCBAP and boxes indicate the approximate location of images shown in panels B–E, G. (B, D) Single cells found in the periphery of the colonies showed a filamentous, cytoskeletal pattern of expression. (C, E) Within CGB+ syncytialized cells, ACTC1 presented in a nuclear pattern of expression. (F) Phalloidin staining for filamentous actin. (Gi–iii) Maximum projections of z stacks created from confocal images on 6-day BAP treated ESCs. Punctate staining for ACTC1 is visible within the nucleus. (B, C, D, E, F Scale = 100 µm; G scale = 25µm). DAPI nuclear staining is shown in blue.

