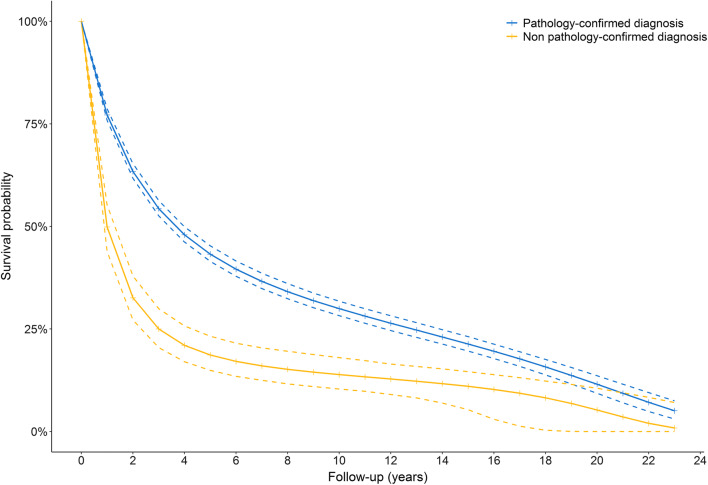
Fig. 2.
Standardised survival curves of individuals with a pathology-confirmed diagnosis (blue) or a non pathology-confirmed diagnosis (yellow). Dashed lines represent 95% confidence intervals. Survival curves are adjusted for age at diagnosis and sex. The risk difference of overall survival between participants with a non pathology-confirmed and a pathology-confirmed diagnosis is 30.8% after 1 year, 29.3% after 2 years, and 22.5% after 5 years

