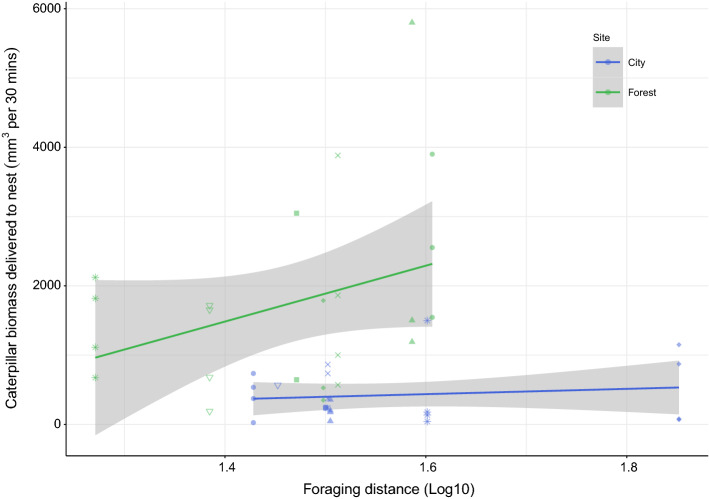
Fig. 1.
The effect of blue tit foraging distance on the biomass of caterpillars delivered to the nests in the forest (green) and the city (blue). The x-axis shows foraging distance (m), averaged for each nestbox and log transformed. Each point on the y-axis represents the total caterpillar biomass delivered to a given nestbox during each of the 30-min video observation periods. Final sample sizes were as follows: n = 23 in the city (5 broods with 4 periods, 1 brood with 2 periods, 1 brood with 1 period, and 1 brood with 0 periods) and n = 23 in the forest (3 broods with 4 periods, 3 broods with 3 periods, 1 brood with 2 periods, and 1 brood with 0 periods). Therefore, several points on the y-axis are plotted against the same foraging distance as they correspond to the same nestbox; it is noted that we have added jitter (using ggplot2; Wickham 2016) to foraging distance for visibility

