
Fig. 1. Radar plot of high autistic traits subgroups.
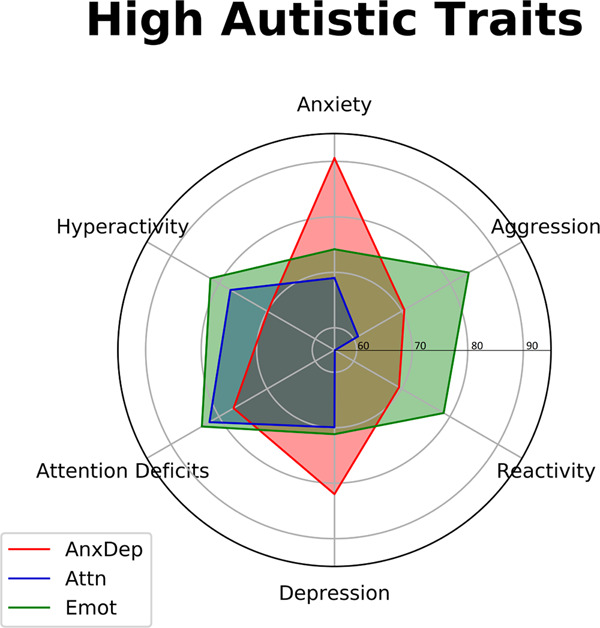
A clustering analysis yielded nine subgroups varying in behavioral composition. From these, three exhibited high SRS levels. The first subgroup (Emot), colored in green, had strong emotional dysregulation (aggression and reactivity) with ADHD-like symptoms. The second subgroup (Attn), colored in blue, showed ADHD-like tendencies. Lastly, the third subgroup (AnxDep), colored in red, exhibited high levels of anxiety and depression, as well as attention deficits. This plot was built upon normalized scores that were converted to a scale of 1 to 100 (as indicated by each encircling gray line) for simplification.