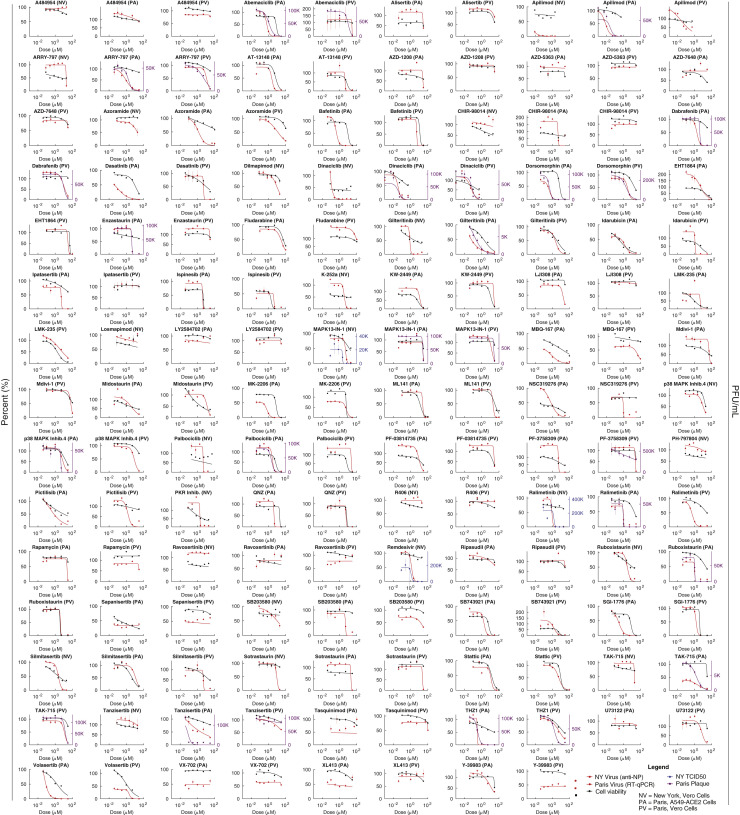
Figure S5.
Pharmacological Profiling for Viral Titers and Cell Viability, Related to Figure 7
Dose response of phosphoproteomics-informed drugs and compounds. Assays performed in New York (N; red, anti-NP; blue TCID50) and Paris (P; red, RT-qPCR; purple, plaque assays) across two cell lines (A549-ACE2 and Vero E6). Cell viability shown in black. Mean of three biological replicates is shown. Error bars are SEM.

