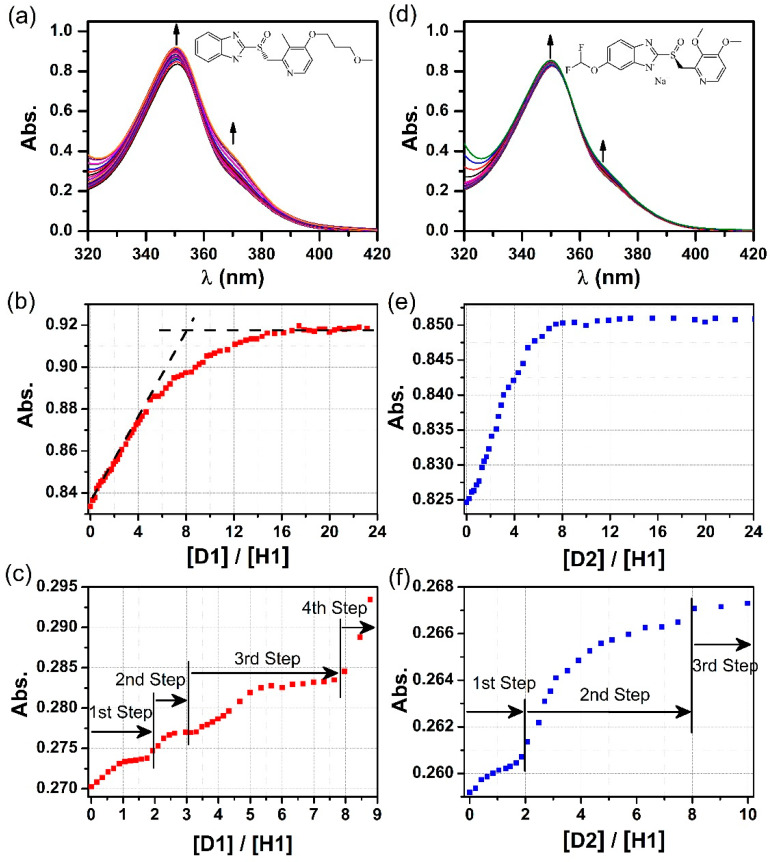
Figure 3.
(a) UV-Vis spectra of host H1 upon titration with D1, and plots of D1/H1 molar ratio vs. absorbance at (b) 350 nm and (c) 370 nm based on the titration experiment. (d) UV-Vis spectra of host H1 upon titration with D2, and plots of D2/H1 molar ratio vs. absorbance at (e) 350 nm and (f) 370 nm based on the titration experiment.

