Figure 3.
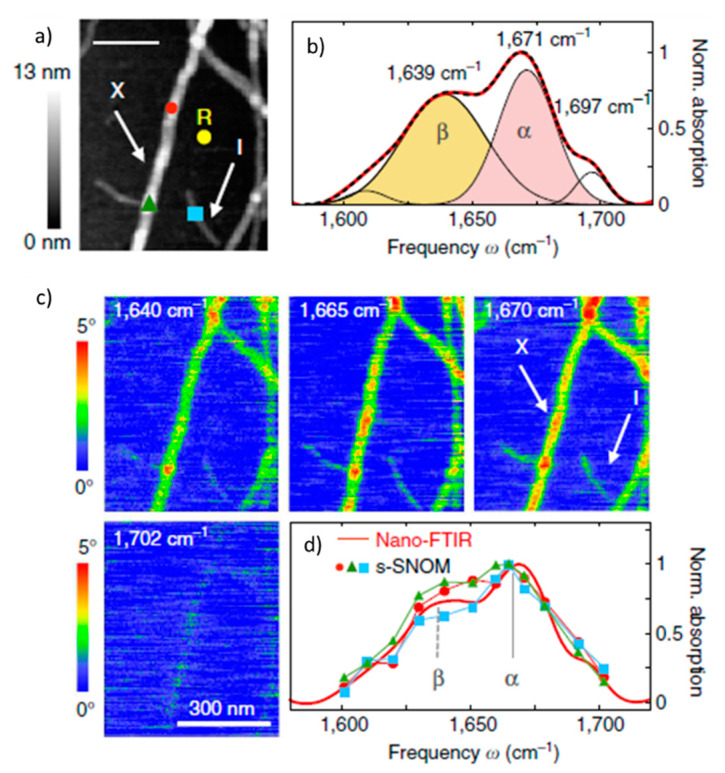
Infrared nanospectroscopy and nanoimaging of insulin fibrils. (a) AFM topography image of insulin fibrils, scale bar: 200 nm; (I) 3-nm thick type I fibril, (X) a 9-nm-thick fibril. (b) the nano-FTIR spectrum (red curve) based on five absorption bands. (c) s-SNOM phase images of the fibrils at fixed wavelengths, scale bar: 300 nm. (d) Single infrared absorption spectra at the positions marked in (a), topography image [61]. Images reproduced under CC BY license.

