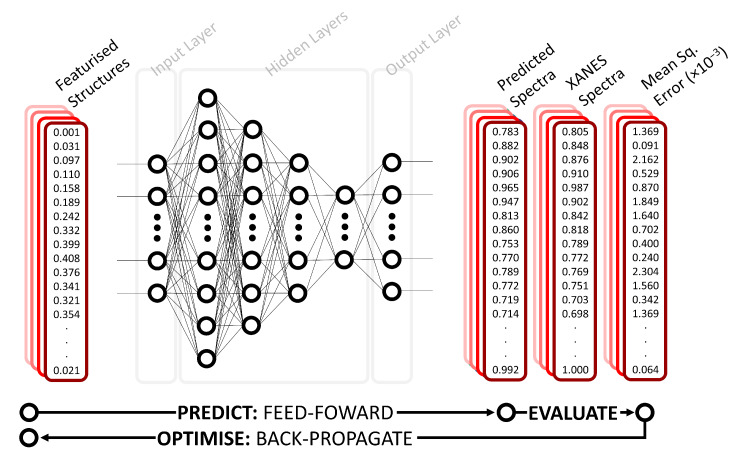
Figure 1.
Schematic representation of the deep neural network (DNN) used in this work. The DNN takes the local environment around an atomic absorption site (featurised using either Coulomb matrix (CM) or radial distribution curve (RDC)) as input. This is passed through the network which consists of four hidden layers to output a predicted spectrum and mean squared error between the theoretical and predicted XANES spectra.

