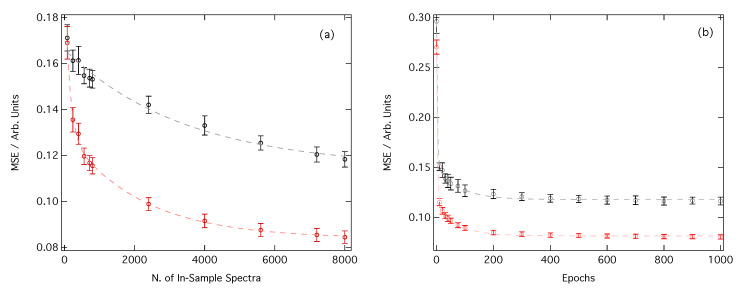
Figure 3.
(a) Evolution of the mean squared error (MSE) as a function of the number of in-sample spectra accessible to the DNN. (b) Evolution of the MSE as a function of the number of forward passes through our dataset (‘epochs’). The local environment around each Fe absorption site has been featurised either as a CM (black) or RDC (red). Data points are averaged over 100 K-fold cross-validated evaluations; error bars indicate one standard deviation.

