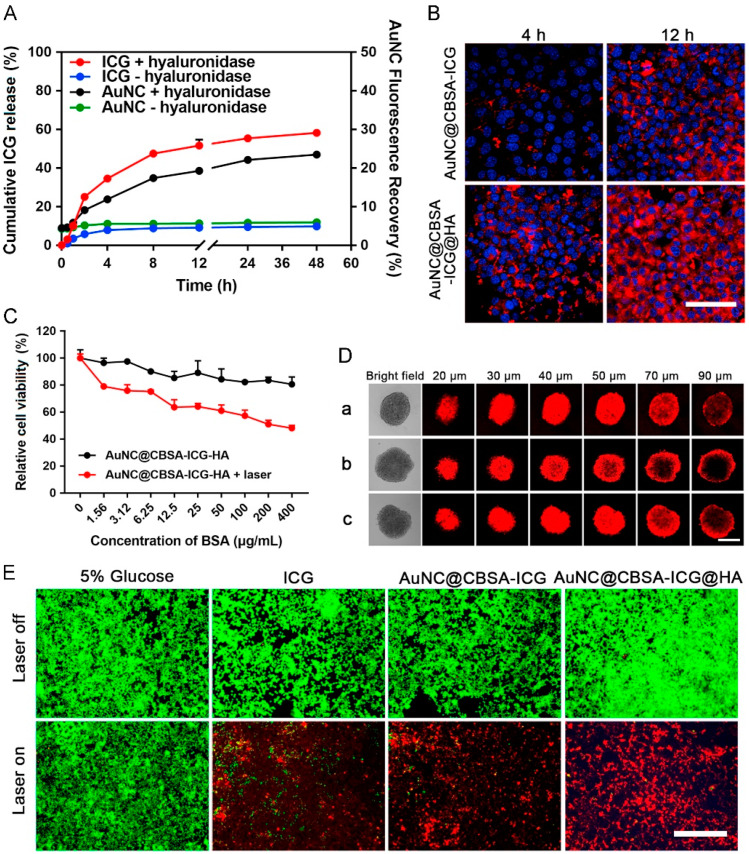
Figure 16.
(A) Cumulative ICG release and fluorescence recovery (drug release real time imaging) with or without hyaluronidase through release procedure. (B) Cellular uptake of nanoparticles after incubation for 4 and 12 h. The white bar represents 50 μm. (C) Cell viability measured by MTT assays. (D) Nanoparticles penetrating into tumor spheroids. The white bar represents 200 μm, a—represents AuNC@CBSA-ICG, b—represents AuNC@CBSA-ICG@HA and c—represents AuNC@CBSA-ICG@HA pretreated with hyaluronidase. (E) The in vitro photothermal effect of formulations measured by calcein-AM/PI double staining. The white bar represents 200 μm. From [113].

