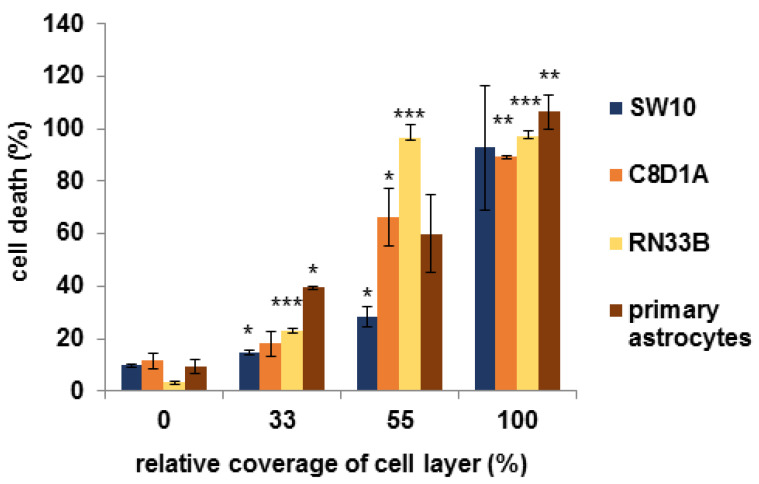
Figure 5.
Tabotamp®-dependent cell death of Schwann cells, neuronal cells and astrocytes. 5 × 10³ Schwann cells (SW10), respectively, 1 × 10⁴ astrocytes (C8D1A; primary astrocytes) or neuronal cells (RN33B) were seeded in triplicates in black flat 96 well plates and incubated for 24 h. Then, 0, 11, 19, and 34 mm2 of Tabotamp® (0, 33, 55, and 100% coverage of cell layer, respectively) and the fluorescence dye CellTox Green was added to the cells as described in manufacturer’s instructions. The fluorescence signal was measured after 30 min. Total cell lysis was set to 100% cell death. Cell free medium served as background control. The figure shows the means and standard deviations of three independent assays. Statistical analysis was performed with one-way ANOVA followed by Dunnett’s post hoc test. Significance was accepted if p-values were <0.05 (* p < 0.05, ** p < 0.025, *** p < 0.001).

