Figure 7.
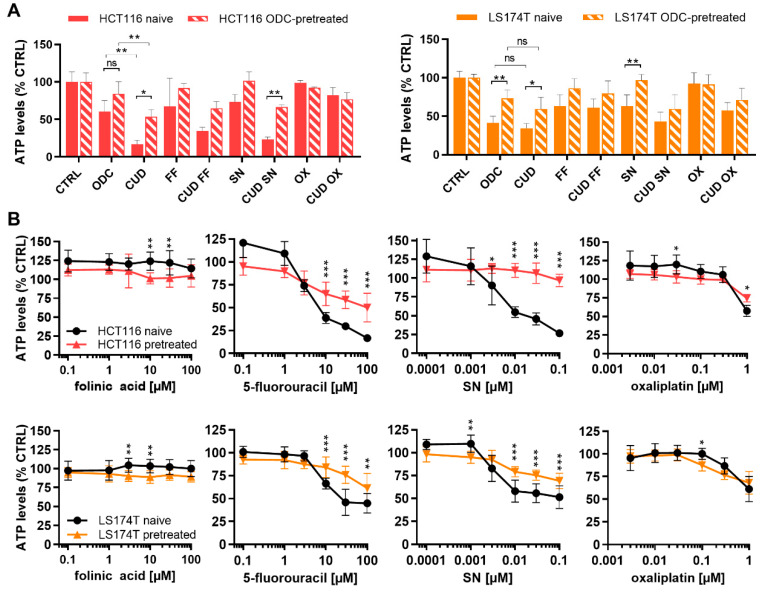
Drug combination activity in chronically ODC-pretreated cells. (A) Drug combination efficacy of the ODC and CUD on cell metabolic activity in HCT116 and LS174T naïve and FA/5-FU/SN/OX pretreated cells (HCT116-pretreated and LS174T-pretreated). (B) Drug dose-response curves of folinic acid (FA), 5-fluorouracil (5-FU), SN and oxaliplatin (OX) in HCT116 and LS174T naïve and FA/5-FU/SN/OX pretreated cells. Drug concentrations are presented on a logarithmic scale. Error bars represent the SD and significances of * p < 0.05, ** p < 0.01 and *** p < 0.001 represent the comparison between naïve and pretreated cells (unpaired t-test) or the comparison between the ODC and CUD (two-way ANOVA with post-hoc Dunnett’s or Sidak’s multiple comparisons test) including (A) N = 3 or (B) N = 3–4, respectively.

