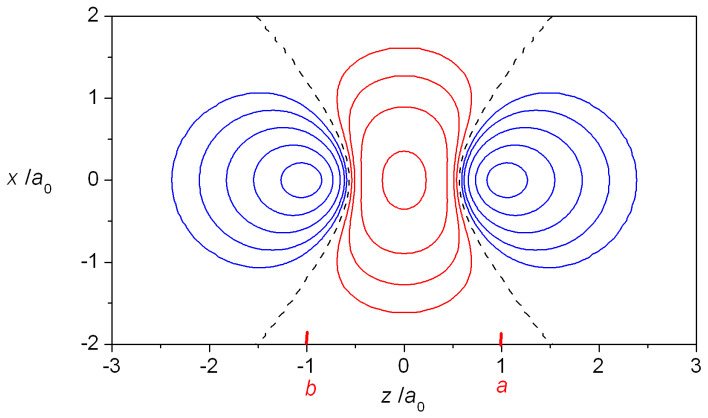
Figure 5.
Contour map of the interference density ρI in the xz plane of H2+ at R = 2.0 a0 and ζ = 1.239 (where z is the internuclear coordinate). The positive/negative contours (ρI+/ρI−) in red/blue are ±0.002, ±0.004, ±0.008, ±0.016, and −0.032. The dashed lines represent zero ρI contours. The nuclei (a, b) are at (0, ±1.0 a0).

