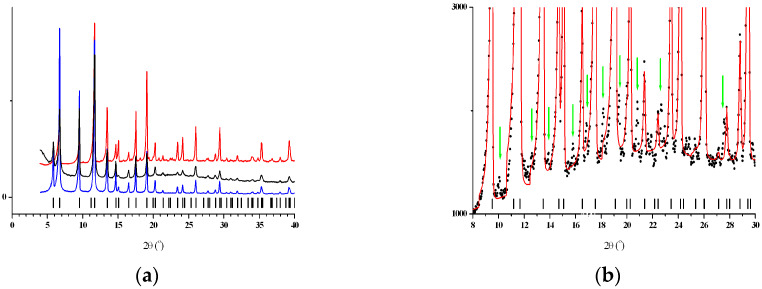
Figure 2.
(a) The combined presentation of the XRD patterns of the HKUST-1mw (red), HKUST-1solv.1 (blue), and HKUST-1solv.2 (black) samples. The vertical black bars denote the positions of the peaks calculated for the cubic unit cell in the space group Fm-3m. (b) The experimental (black dots) and calculated (red line) powder XRD patterns of the HKUST-1mw sample. The vertical black bars denote the positions of the peaks calculated for the cubic unit cell in the space group Fm-3m. The vertical green arrows show the positions of some additional weak peaks.

