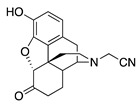
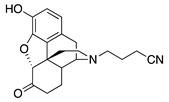
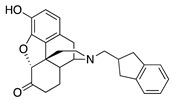
Table 1.
Opioid Receptor Binding Data a (Ki, nM) and Stimulation of [35S]GTPγS b Binding at MOR (μ), DOR (δ) and KOR (κ) opioid receptors.
| Receptor Binding (Ki, nM) | [35S]GTPγS | ||||||
|---|---|---|---|---|---|---|---|
| Compound | Structure | MOR Binding |
DOR Binding |
KOR Binding |
MOR EC50 c, nM (% Stimulation) | DOR EC50 c, nM (% Stimulation) |
KOR EC50 c, nM (% Stimulation) |
| Group 1. N-Cyanoalkyl Compounds and Compounds Lacking Substituents on the Aromatic Ring | |||||||
| 1a |

|
4.51 ± 0.27 | 141 ± 2.8 | 90.3 ± 6.6 | 425 ± 133 (47.1 ± 3.3) |
NT | NT |
| 1b |

|
4.25 ± 0.29 | 72.2 ± 1.2 | 2.71 ± 0.22 | DNS | NT | 24.3 ± 5.0 (89.6 ± 0.9) |
| 1c |

|
90.5 ± 11.0 | NT | NT | NT | NT | NT |
| 1d |

|
40.1 ± 5.9 | 844 ± 107 | NT | NT | NT | NT |
| Group 2. Nitro Substituents | |||||||
| 2a |

|
0.52 ± 0.01 | 6.07 ± 0.86 | 56.0 ± 8.2 | 1.9 ± 0.5 (26.6 ± 1.4) |
227 ± 53 (64.3 ± 3.3) |
NT |
| 2b |

|
5.88 ± 0.38 | 92.5 ± 7.3 | 65.4 ± 7.7 | DNS | NT | NT |
| Group 3. Alkyl and Alkoxy Substituents | |||||||
| 2c |

|
0.86 ± 0.12 | 6.34 ± 0.65 | 44.0 ± 3.8 | 1.9 ± 0.7 (55.6 ± 2.1) |
23.1 ± 6.9 (95.4 ± 3.8) |
38.1 ± 10.6 (31.4 ± 4.2) |
| 2d |

|
0.67 ± 0.05 | 5.43 ± 0.47 | 26.3 ± 1.9 | DNS | 33.6 ± 6.4 (48.9 ± 3.2) |
5.9 ± 1.7 (21.8 ± 0.8) |
| Group 4. Halides and Trifluromethyl Substituents | |||||||
| 2e |

|
0.87 ± 0.10 | 13.4 ± 0.9 | 44.3 ± 6.0 | 2.5 ± 0.3 (42.6 ± 2.9) |
64.2 ± 9.9 (243 ± 49) |
DNS |
| 2f |

|
0.49 ± 0.07 | 4.48 ± 0.43 | 30.2 ± 2.3 | 2.4 ± 0.3 (56.8 ± 7.5) |
54.1 ± 4.7 (86.7 ± 8.0) |
DNS |
| 2g |

|
0.32 ± 0.04 | 3.57 ± 0.49 | 23.2 ± 2.8 | 2.1 ± 0.7 (100 ± 0.3) |
92.7 ± 17.0 (83.0 ± 3.3) |
DNS |
| 2h |

|
2.70 ± 0.17 | 16.4 ± 0.4 | NT | 3.4 ± 1.2 (72.2 ± 5.5) |
35.7 ± 12.3 (82.3 ± 2.3) |
NT |
| 2i |

|
1.09 ± 0.06 | 7.89 ± 1.10 | NT | 2.0 ± 1.0 (39.0 ± 2.1) |
2.4 ± 0.7 (83.8 ± 3.7) |
NT |
| Standard | |||||||
| - | Morphine | 3.26 ± 0.39 | NT | 145 ± 15 | 194 ± 21 (57 ± 5) [31] |
NT | NT |
a Binding assays were typically conducted in at least three independent experiments, each performed with triplicate observations using whole rat brains excluding cerebellum; Ki ± SEM (nM); NT = not tested—inactive (<50% activity at 100 nM concentration in exploratory binding assays (displaced less than half of radioligand). Also, compounds with low binding affinity (>50 nM) were not further examined in functional assays); b [35S]GTPγS functional assays: % stimulation compared to standard maximal at each receptor MOR = DAMGO; DOR = DPDPE; KOR = U69593) in C6 cells expressing MOR or DOR or CHO cells expressing KOR. All experiments were repeated on three separate occasions in duplicate. Values are given as means ± SEM; DNS = no stimulation (indicates antagonist activity when coupled with high receptor binding affinity); c EC50 = Effective dose for 50% maximal response.
