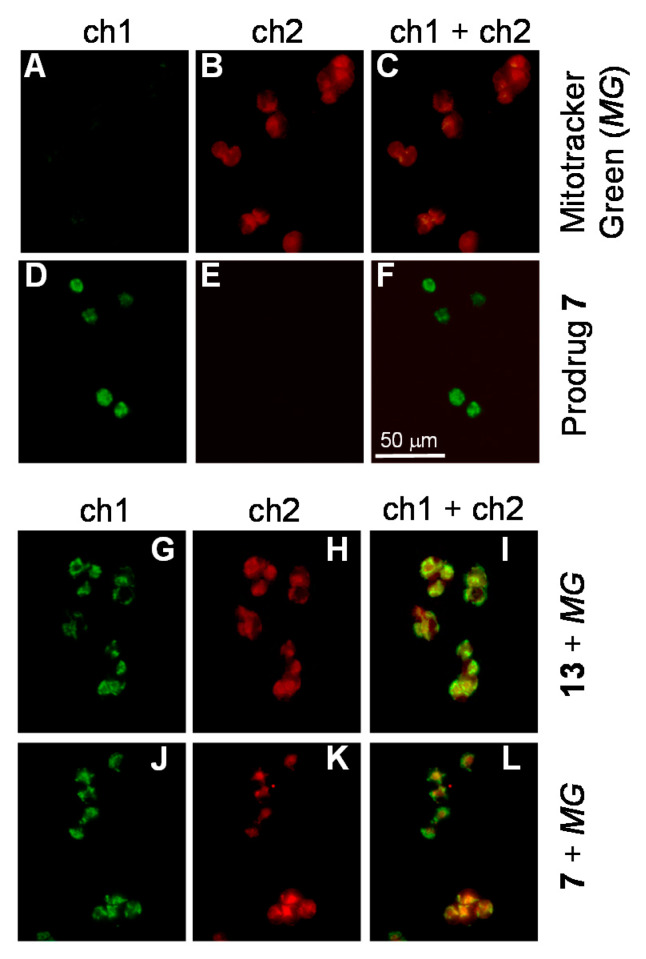
Figure 4.
(A–C) Incubation of A2780 cells with Mitotracker green (MG, 100 nM) for 30 min and imaging the cells using channels 1 (ch1: excitation in the range of 450–490 nm and emission in the range of 500–550 nm) and 2 (ch2: excitation in the range of 538–563 nm and emission in the range of 570–640 nm). Mathematical sum of ch1 and ch2 is shown in inset C. (D–F) The same as A–C, except that MG was replaced with prodrug 7 (100 nM). (G–I) The same as A–C, except that MG was replaced with a mixture of control 13 (100 nM) and MG (1 eq). Pearson’s coefficient is 0.93; (J–L) The same as A–C, except that MG was replaced with a mixture of prodrug 7 (100 nM) and MG (1 eq). Pearson’s coefficient is 0.87.

