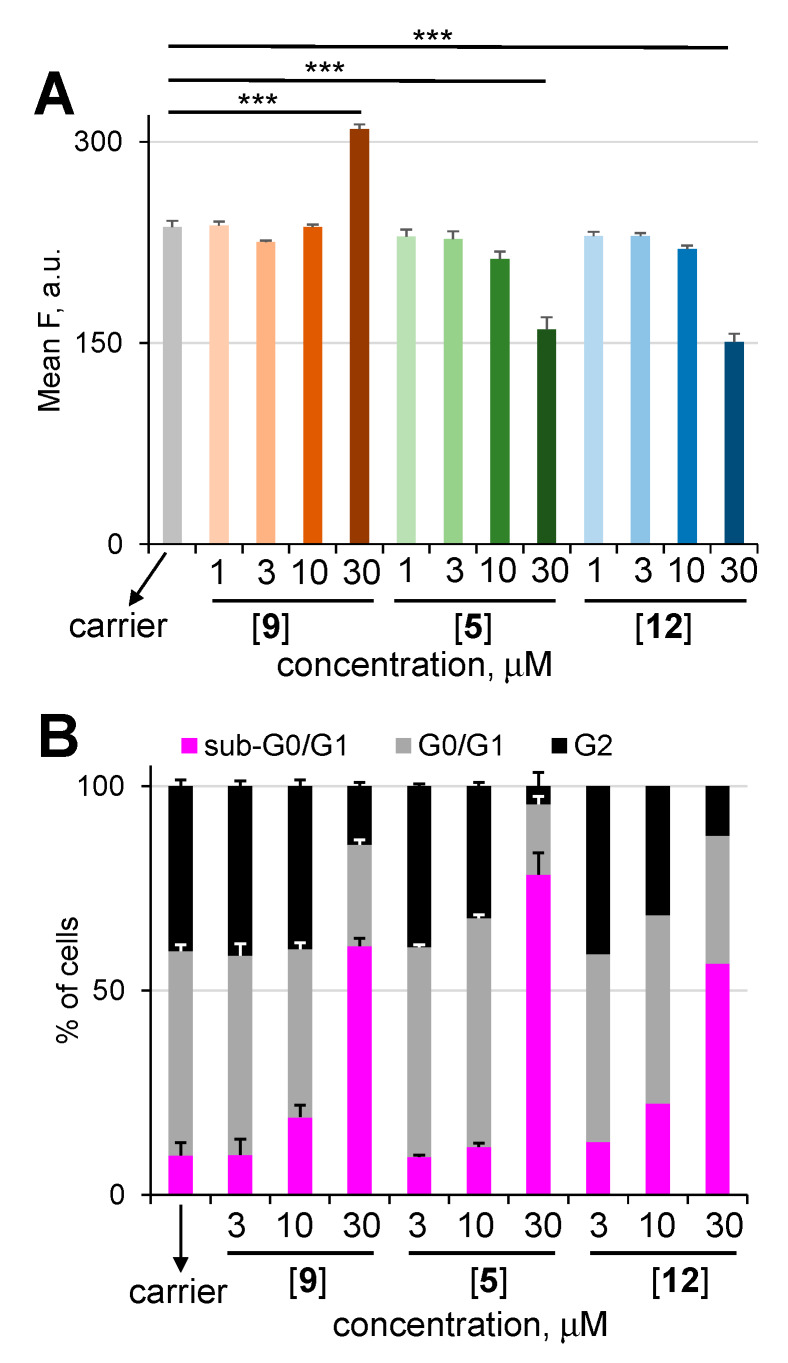
Figure 6.
(A) Effect of prodrug 5 and controls 9 and 12 used at the indicated on the plot concentrations on the intracellular glutathione (GSH) content of viable (Ax-/PI-) Jurkat cells (incubation time: 48 h). Fluorescence intensity corresponding to GSH-sensitive dye monobromobimane is plotted on the OY-axis (λex = 405 nm; λem = 390–470 nm). (B) Effect of prodrug 5 and controls 9 and 12 used at the indicated-on plot concentrations (incubation time: 48 h) on cell cycle of Jurkat cells. Student’s t-test: ***—p < 0.001.

