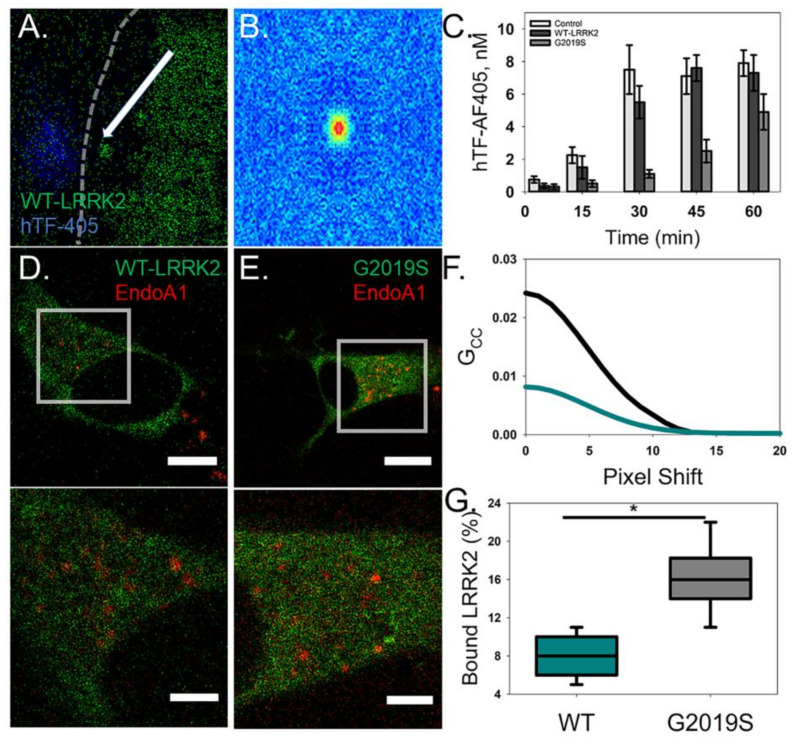
Figure 4.
G2019S-expressing cells show a reduction in endocytosis of human transferrin. (A) A representative image of a WT LRRK2-GFP (green)-expressing cell treated with hTF-AF405 (blue). Arrow depicts a LRRK2 bound vesicle that moved to and from the site of the membrane (dashed white line) with clustered hTF-AF405. (B) Cross-correlation raster image correlation spectroscopy (ccRICS) autocorrelation function (ACF) of LRRK2 and hTF. (C) Control and transfected cells were treated with hTF-AF405 and the amount of internalized hTF-AF405 was determined, using RICS, at the designated time points. Error is shown as the S.E.M. (D,E) Representative intensity images of cells co-expressing EndoA1-mCherry (red) with either WT LRRK2-GFP (left; green) or G2019S LRRK2-GFP (right; green). Scale bar is 15 µm. ROI selected for ccRICS analysis corresponding to the boxed regions within the full cell intensity images. Scale bar is 3 µm. (F) Representative fits of the ccRICS ACF for WT (dark cyan) and G2019S (black) with EndoA1-mCherry. (G) The amount of LRRK2 interacting with EndoA1-mCherry as a percentage of total protein (p < 0.05).

