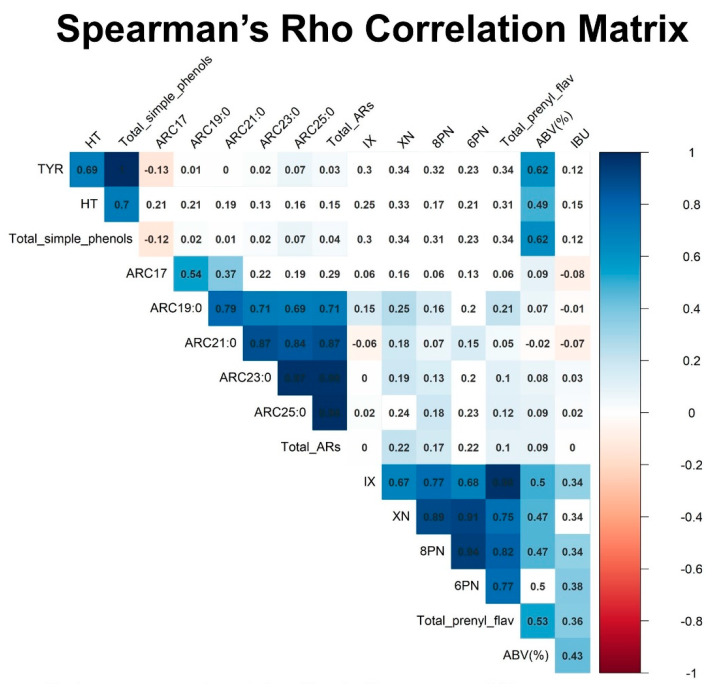
Figure 1.
Spearman’s Rho correlation matrix of the studied phenolic compounds in the overall beer sample (n = 45). Blank squares represent correlations of p > 0.05. Tyrosol (TYR). Hydroxytyrosol (HT). Sum of TYR and HT (total simple phenols). Alkylresorcinols (ARs). Sum of AR-C17:0, AR-C19:0, AR-C21:0, AR-C23:0, AR-C25:0 (total AR). Xanthohumol (XN). Isoxanthohumol (IX). 8-prenylnaringenin (8PN). 6-prenylnaringenin (6PN). Sum of XN, IX, 8PN and 6PN (total prenylated flavonoids). Percentage of alcohol by volume (%ABV). International bitterness units (IBU).

