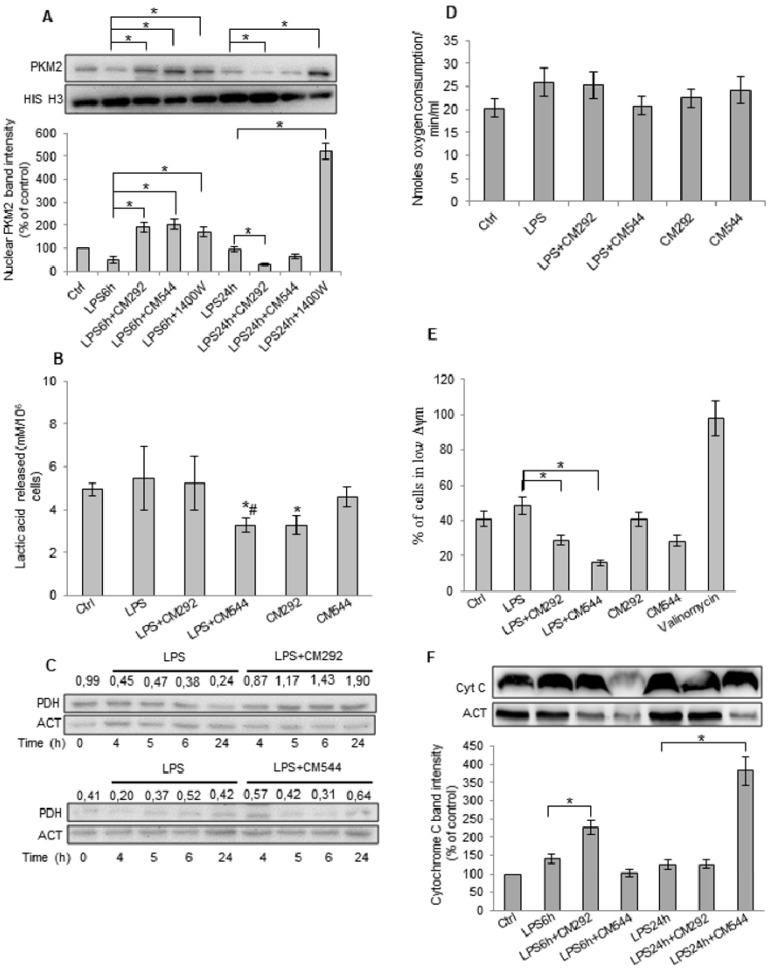
Figure 5.
CM292 and CM544 reverted the effects of LPS on the metabolic profile of BV2 microglial cells. BV2 microglial cells were pre-treated with 10 μg/mL LPS for 3 h, and then 200 μM CM292 or CM544 and 10 μM 1400W were added for further for 3 h or 21 h. (A) Western blotting analysis of nuclear PKM2 at indicated time. Histone H3 was used as loading control. Bars represent the ratio between respective protein and histone H3 band intensity. The images are representative of one out of three separate experiments; (B) lactic acid released after 24 h exposure. Data represent mean ± SD of n = 3 independent experiments performed in triplicate. * p < 0.05 vs. control cells. # p < 0.05 vs. LPS treated cells; (C) Time course of pyruvate dehydrogenase (PDH). At each indicated time, cells were collected, and total extract analyzed by Western blotting. β-actin was used as loading control. Numbers above the images represent the ratio between respective protein and β-actin band intensity. The images are representative of one out of three separate experiments. (D) Oxygen consumption after 24 exposure. Data represent mean ± SD of n = 3 independent experiments performed in duplicate. * p < 0.05 vs. control cells. # p < 0.05 vs. LPS treated cells; (E) Δψm after 24 h exposure. Bars represent the percentage of cells with low Δψm. (F) Western blotting analysis of total cytochrome C. Actin was used as loading control. The images are representative of one out of three separate experiments.

