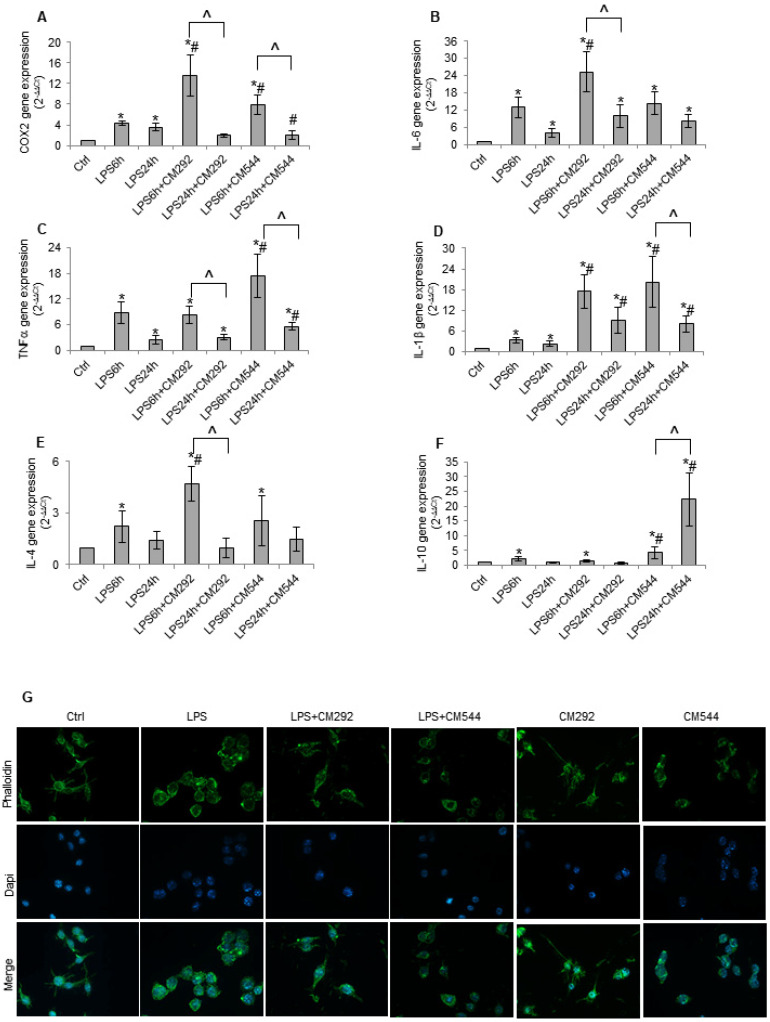
Figure 6.
CM292 and CM544 reverted LPS-induced inflammatory response. BV2 microglial cells, pre-treated for 3 h with 10 μg/mL LPS, were then exposed for various time to 200 μM of iNOS inhibitors and used for (A–F) qRT-PCR of the indicated genes after 6 and 24 h LPS exposure. Gene expression values were normalized to Gapdh and presented as 2−ΔΔCt. Relative mRNA gene abundance in untreated cells was assumed to be 1 (control). Data represent mean ± SD of n = 3 independent experiments performed in triplicate. * p < 0.05 vs. control cells, # p < 0.05 vs. LPS treated cells, ^ p < 0.05 vs. the respective 6 h treatment; (G) Phalloidin staining after a 24 h exposure. The images are representative of one out of three separate experiments. Magnification 40×.

