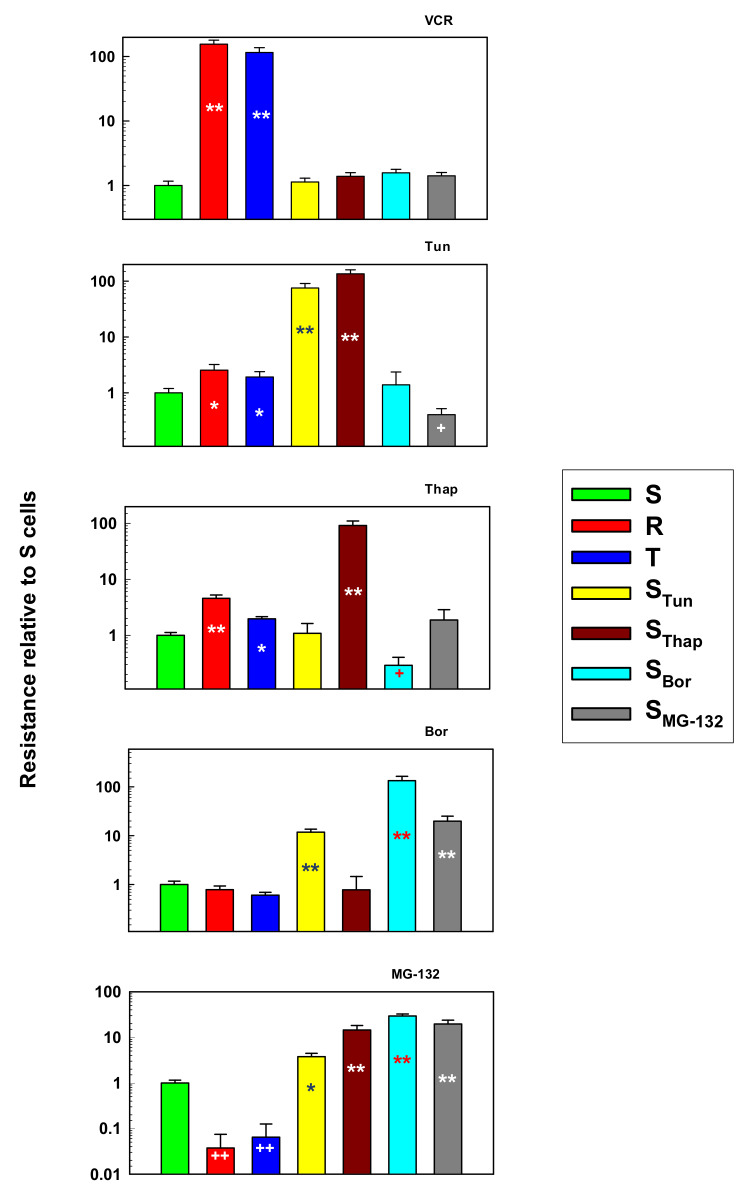
Figure 1.
Sensitivities of S, R, T, STun, SThap, SBor and SMG-132 cells to vincristine (VCR), tunicamycin (Tun), thapsigargin (Thap), bortezomib (Bor), and MG-132. Cells were cultivated for two days in the presence of these substances in a concentration range of 10-4–10 μM, and the LC50 values were calculated according to Equation (1) (See the Section 4). Data are expressed relative to the LC50 value for S cells, which was arbitrarily set as one. Cell survival was measured by the MTT test. Data represent the calculated value ± SD for 27 degrees of freedom. Significance: * and ** significantly higher than the value obtained for S cells at p < 0.02 and p < 0.002, respectively. + and ++ significantly lower than the value obtained for S cells at p < 0.05 and p < 0.01, respectively.

