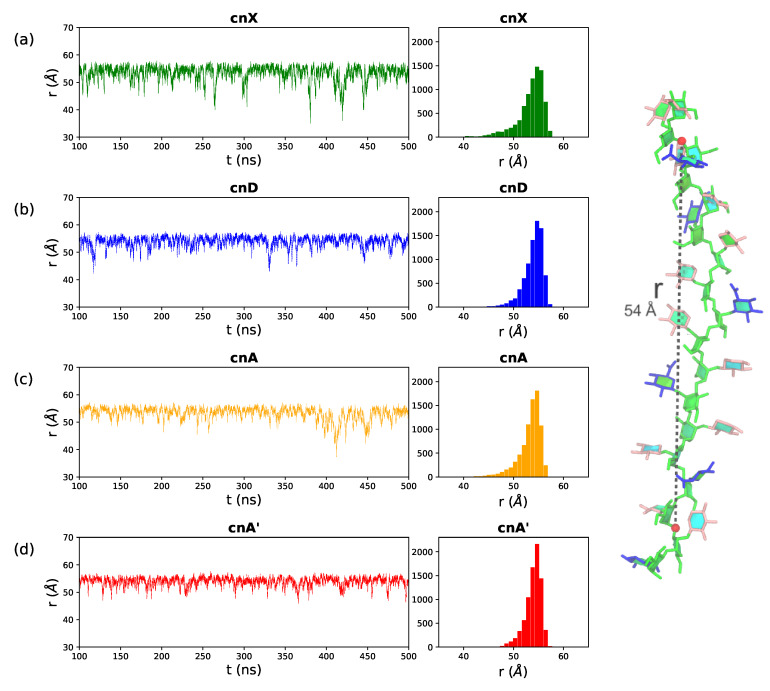
Figure 3.
End-to-end distance, r, time series and corresponding histograms for the (a) cnX, (b) cnD, (c) cnA and (d) cnA’ GXM chains. The first 100 ns of simulation are considered equilibration and are not shown. Here r is defined to exclude the two terminal residues on either end of the chain, as the distance from O3 in the second linkage to O3 in the 16th linkage in the 18-mannose backbone—labelled for cnA in the image on the right. The residues and substitutions are coloured as follows: DMan—green; DGlcA—blue; DXyl—pink; and 6-OAc—red.

