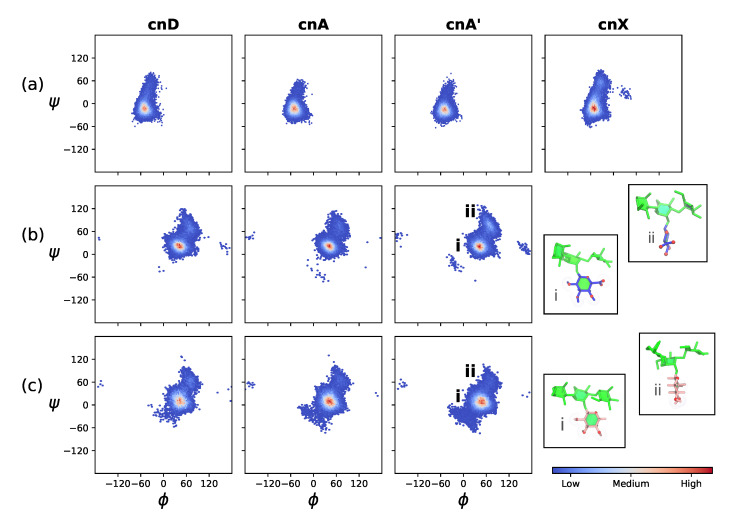
Figure 4.
Heat maps of the glycosidic linkage orientation distribution over the last 400 ns of simulation in the two central RUs (RU3 and RU4) in the GXM chains. Row (a) shows the backbone DMan(1→3)DMan linkage, row (b) the DGlcA(1→2)DMan side chain linkage and row (c) the DXyl(1→2)DMan side chain linkage. Glycosidic linkage orientations are shown as rotations of the linkage dihedral angles and . The insets in row (b,c) show the major face-on (i) and minor edge-on (ii) orientations of the (1→2)-linked side chains relative to the mannan backbone. The residues and substitutions are coloured as follows: DMan—green; DGlcA—blue; DXyl—pink; and 6-OAc—red.

