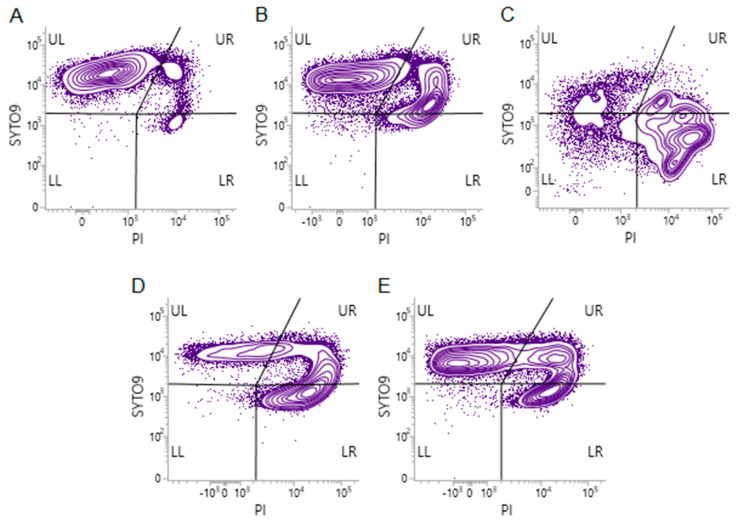
Figure 3.
Flow cytometric analysis of E. coli CECT 434 treated with different EO compounds. Bacterial cell samples were stained with a mixture of Syto® 9 and PI. The Figure shows different staining patterns of (A) untreated; (B) eugenol-treated; (C) trans-cinnamaldehyde-treated; (D) citronellol-treated; and (E) terpineol-treated cell samples. UL (upper-left), Syto® 9+PI– and healthy cells; UR (upper-right), Syto® 9+PI+ and moderately damaged cells; LR (lower-right), Syto® 9–PI+ and severely damaged cells; LL, (lower-left), Syto® 9–PI– and unknown cells.

