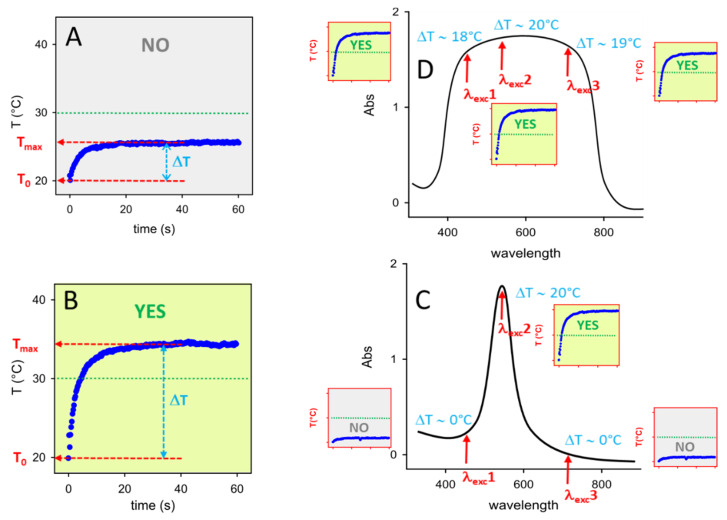
Figure 1.
(A) and (B): examples of typical thermograms, i.e., T vs time profiles obtained irradiating a photothermally responsive printed pattern. ΔT values are calculated as the T differences Tmax − T0 evidenced by the azure double arrows; T0 is 20 °C in both examples; a threshold ΔT of 10 °C has been chosen: in panel A ΔT < 10 °C (thermal answer: NO), in panel B ΔT > 10 °C (thermal answer YES). (C): visual sketch of how the photothermal answer changes by changing λexc with a print having a sharp absorption peak: small thermograms in the red-framed squares are what obtained (left to right) with λexc1 (ΔT < 10 °C, answer: NO), λexc2 (ΔT > 10 °C, answer: YES); λexc3 (ΔT < 10 °C, answer: NO). (D): same, but with a large featureless absorpion band: at the same three λexc of panel C all the thermograms (red-framed squares) give ΔT > 10 °C, i.e., a YES answer.

