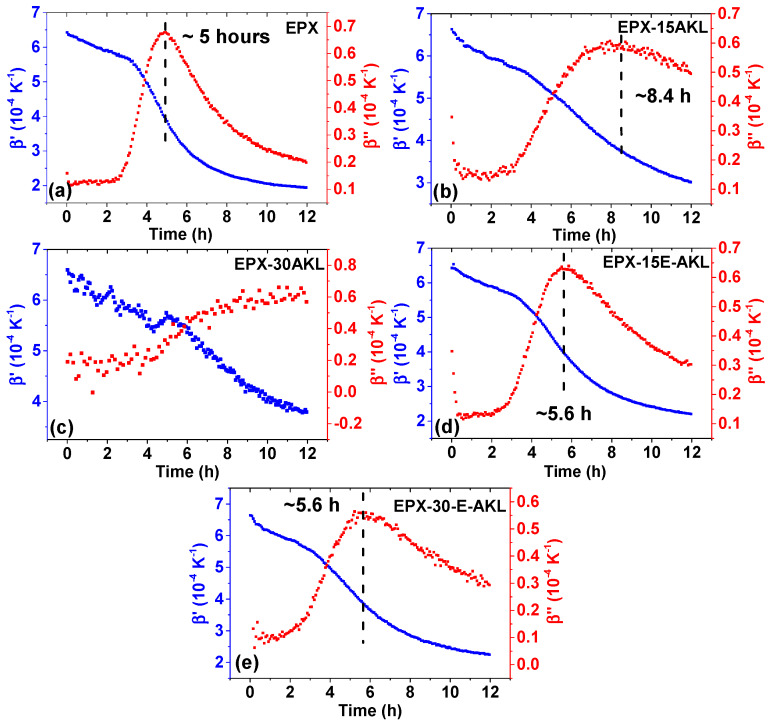
Figure 8.
Temporal evolution of the dynamic thermal volume expansion coefficient of all samples (real part, b’, left axis and imaginary part, b’’, right axis). The chemically induced glass transition of each sample is indicated in the corresponding graph. (a) EPX, (b) EPX-15AKL, (c) EPX-30AKL, (d) EPX-15E-AKL, and (e) EPX-30-E-AKL.

