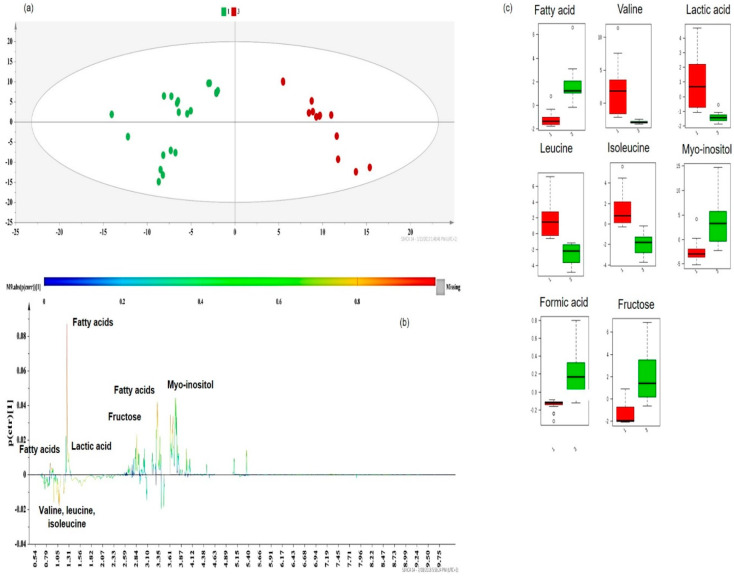
Figure 10.
(a) OPLS-DA model of Group 1 vs. Group 3 DOE apricot extracts, Pareto scaled, where A = 1 + 1 + 0 (N = 32, R2Y(cum) = 0.889, Q2(cum) = 0.836, p < 0.05), green dots = apricot pulp samples with a low extraction yield (≤5 mg carotenoids 100 g−1 dry sample), and red dots = apricot pulp samples with a medium extraction yield (≥15 mg carotenoids 100 g−1 dry sample); (b) S-line plot of the OPLS-DA model; (c) box-plots of the discriminant metabolites, where red box-plots correspond to Group 1 (green dots) and green box-plots correspond to Group 3 (red dots).

