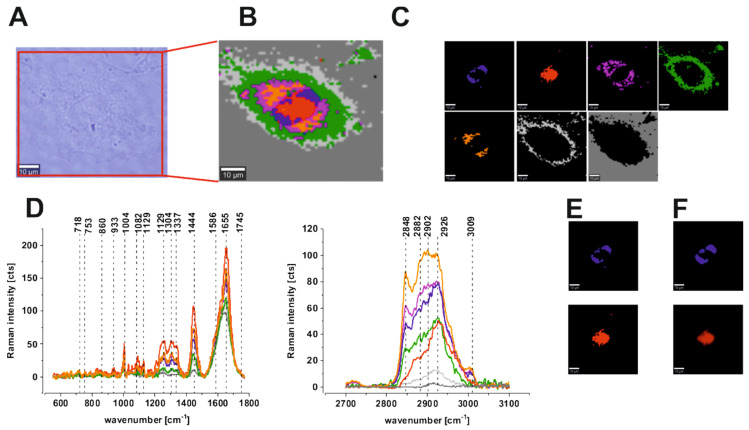
Figure 9.
Microscopy image (A), Raman image constructed based on CA method (B), Raman images of all clusters identified by CA, nucleus (red), mitochondria (magenta), lipid-rich regions (blue and orange), membrane (light gray), cytoplasm (green), cell environment (dark gray) (C), Raman spectra typical of all clusters for low- and high-frequency regions (D), Raman clusters typical of all lipid-rich structures (blue), nucleus (red) (E), and fluorescence staining (F) obtained using Red Oil-O to visualize lipid-rich regions including lipid droplets (blue) and Hoechst 33342 to visualize nucleus (red) for CCD18-Co normal human colon cells. The colors of the spectra correspond to the colors of the clusters.

