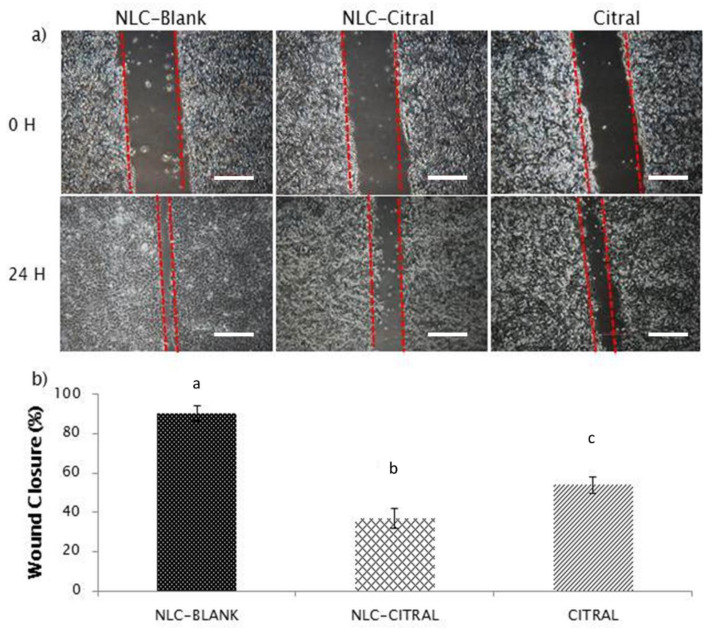
Figure 2.
The representative images and bar chart analysis of wound healing treated with 26 µg/mL (IC40) of NLC-Citral, citral, and NLC-Blank for 24 h. The wound closure was measured in between the wound scratched. Each value in the bar chart is represented as mean ± SD and the experiment was performed in triplicate. Significance indicated by different alphabet was set at p < 0.05, comparing between groups. The scale bars show 500 px (13.2 cm).

