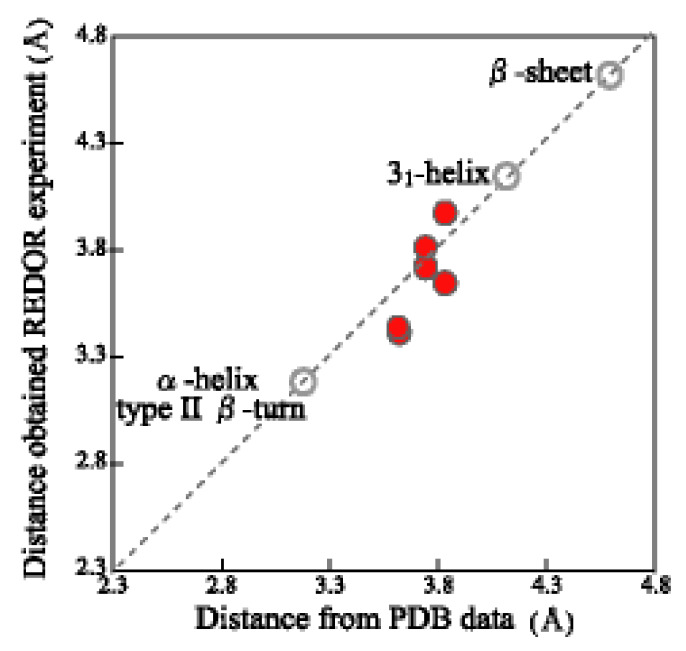
Figure 4.
Plot of the REDOR-determined inter-nuclear distances of the 13C–15N nuclei in Table 1(I) vs. the corresponding distances calculated from the PDB database. The red circles indicate the inter-nuclear distances between [1-13C]Gly and [15N]Gly nuclei in the [1-13C]Gly-X-[15N]Gly (X = Q,Y,L, and R) motifs determined by REDOR experiment in Table 1(I) and those calculated from the PDB database. The grey hollow circles are corresponding distances of typical conformations: anti-parallel β-sheet; 4.6 Å, α-helix and type II β-turn; 3.2 Å and 31-helix; 4.2 Å [46].

