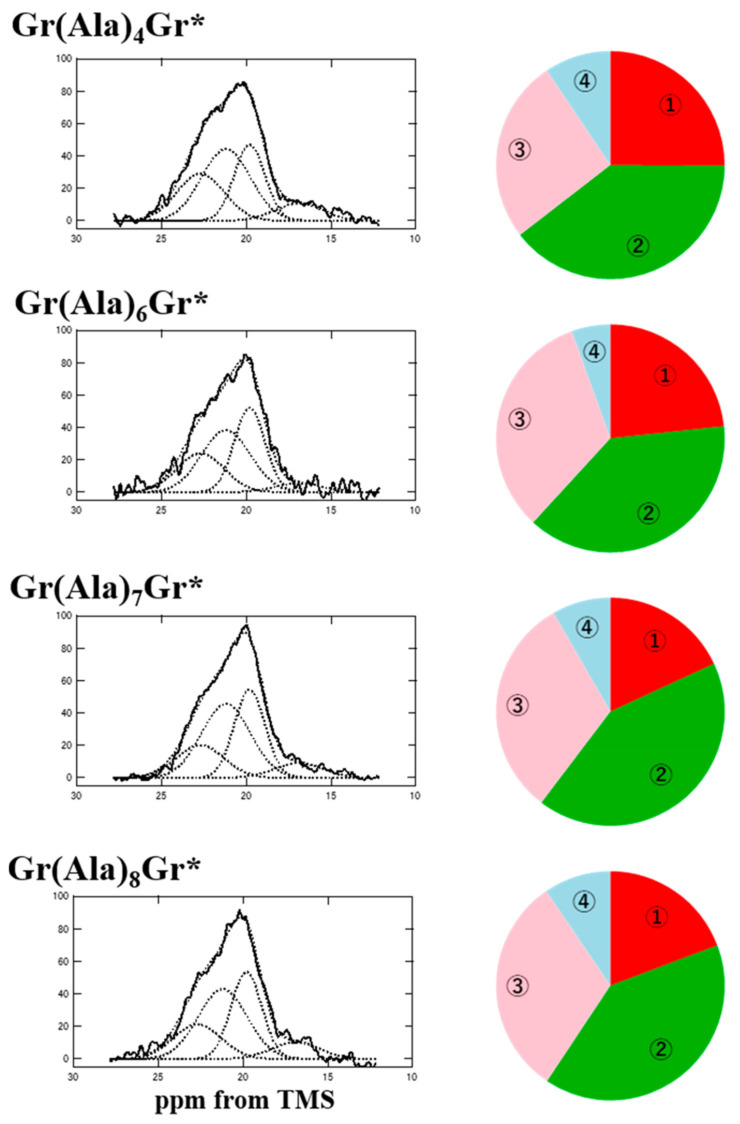
Figure 8.
(Left) Expanded dipolar dephasing 13C DD/MAS NMR spectra of the Ala Cβ regions of Gr(Ala)nGr* (n = 4 and 6−8) after FA/MeOH treatment [63]. The decomposed four spectra shown by broken lines were obtained by the deconvolutions under assuming the chemical shifts as 22.7, 21.2, 19.8 and 16.9 ppm from lower field to higher field, respectively. (Right) Pie charts of the fractions determined by the deconvolutions. The color of the fraction is ① red (22.7 ppm), ② green (21.2 ppm), ③ pink (19.8 ppm), and ④ light blue (16.9 ppm; right).

