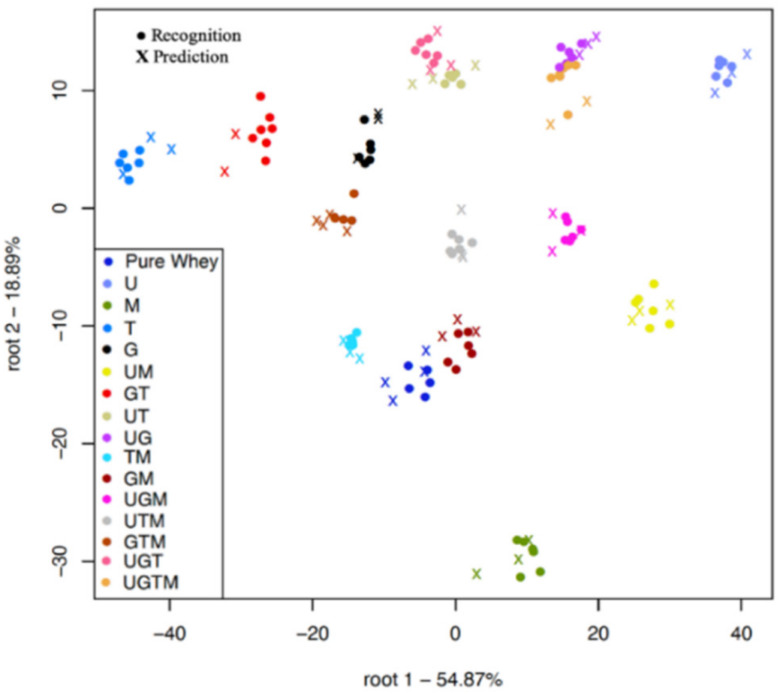
Figure 3.
Classification plot of the benchtop spectrometer for the 15-mixture combination using the data of samples with the lowest adulteration level of 0.5% w/w and the pure whey protein powder. U = urea, G = glycine, T = taurine, M = melamine. Spectral pre-processing: Savitzky-Golay smoothing (second order polynomial).

