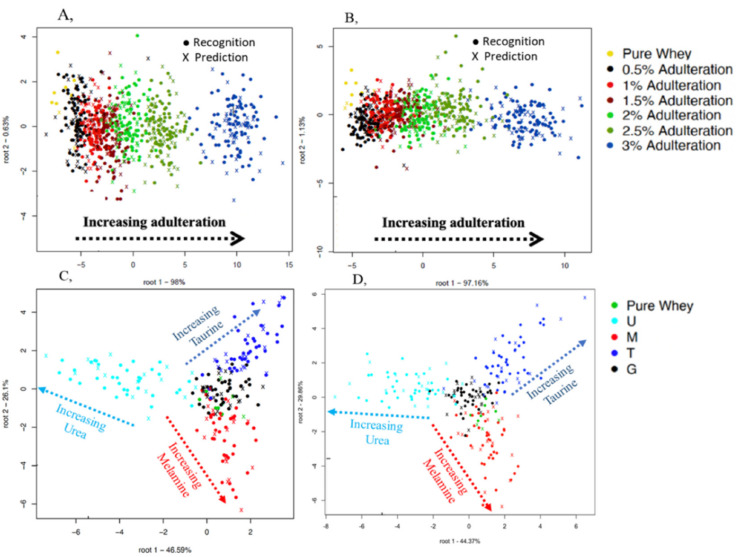
Figure 4.
Classification plots of the handheld spectrometer for adulterant concentration levels ((A), optical glass, and (B) commercial low density polyethylene (LDPE) plastic bag) using the entire dataset and single mixture combinations ((C), optical glass, and (D), commercial LDPE plastic bag) using the data of samples containing single adulterants and pure whey protein powder. U = urea, G = glycine, T = taurine, M = melamine. Spectral pre-processing: Savitzky-Golay smoothing and multiplicative scatter correction (MSC).

