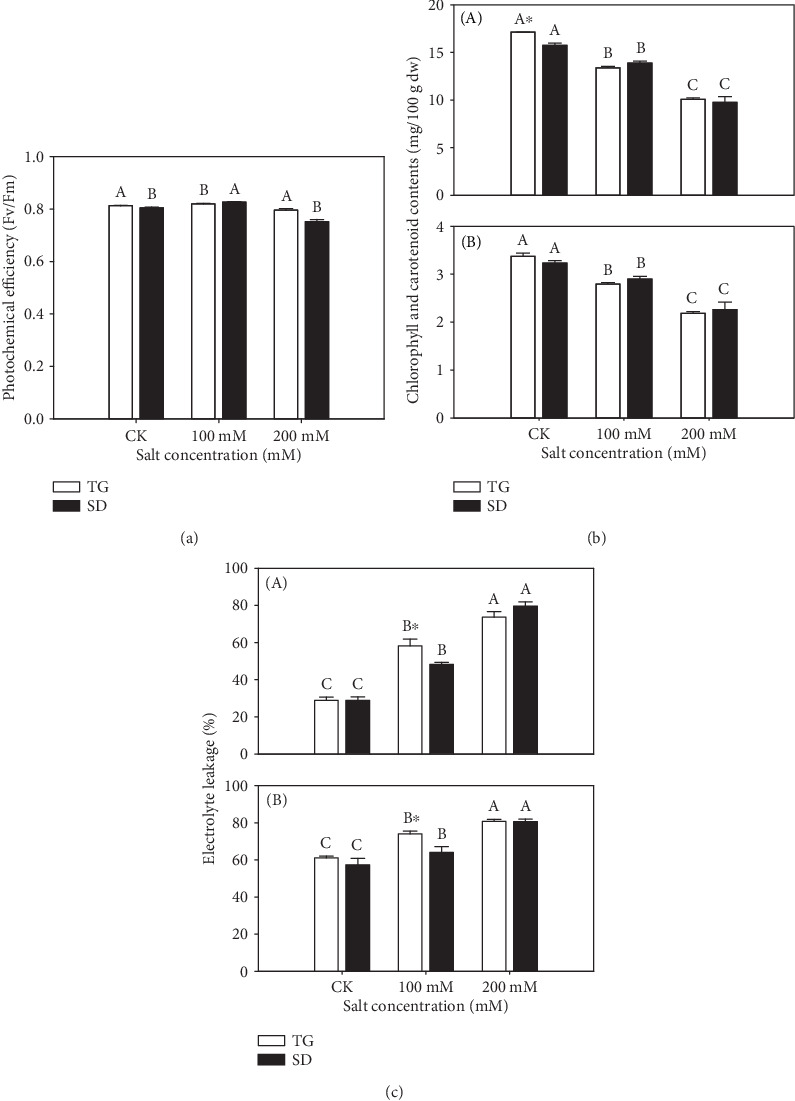
Figure 1.

Effects of salt stress on (a) photochemical efficiency (Fv/Fm) in leaves of “TG” and “SD” and (b) chlorophyll and carotenoid content in (A) leaves of “TG” and “SD” (B) roots of “TG” and “SD.” Meanwhile, (c) electrolyte leakage (%) in (A) leaves of “TG” and “SD” and (B) roots of “TG” and “SD” purslane genotypes at 0, 100, and 200 mM salt stress. Vertical bars indicate the SE of each mean (n = 4). Columns marked with small letters indicate significant differences between salt treatments for “TG” or “SD” based on the LSD test (P = 0.05). Columns marked with a star represent statistical significance for comparison between species at a given NaCl treatment (P = 0.05).
