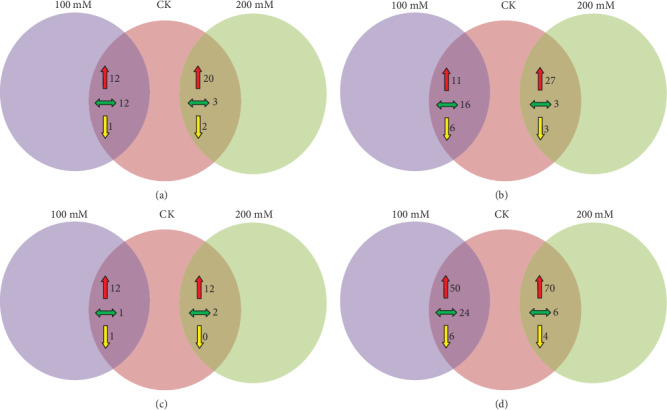
Figure 2.

Venn diagrams showing the global comparison of metabolite profile in (a) leaves of “Tall Green,” (b) roots of “Tall Green,” (c) leaves of Shandong Wild, and (d) roots of Shandong Wild purslane after 28 days of salt treatment. A total of 132 compounds were identified by GC-MS, and the numbers in the figure indicate the number of metabolites with a significant up- and downregulation or no fold change. Red and yellow arrows represent the upregulated (>1.5-fold) and downregulated metabolites (<1-fold), respectively, while green arrows represent no fold change.
