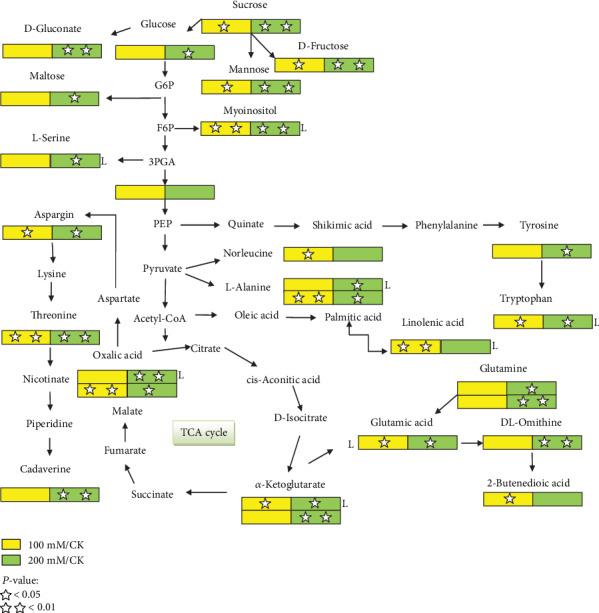
Figure 5.

Metabolic pathway showing the log2 fold change of identified metabolites in leaves and roots of “TG” purslane. Alphabet “L” represents significant differences of metabolites in leaves, and besides this, all others represent significant differences of metabolites in roots under 0, 100, and 200 mM of salt stress. Square boxes marked with stars represent statistical significance for comparison between species at a given NaCl treatment (P = 0.05).
