Figure 1.

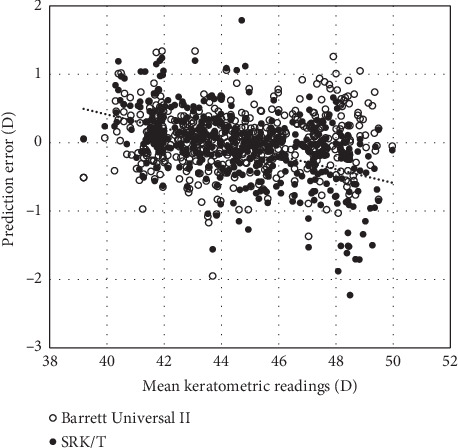
A graph showing correlations between the prediction error and the mean keratometry (Pearson correlation coefficient, r = −0.031, p=0.576 for the Barrett Universal II formula, and r = −0.522, p < 0.001 for the SRK/T formula).

A graph showing correlations between the prediction error and the mean keratometry (Pearson correlation coefficient, r = −0.031, p=0.576 for the Barrett Universal II formula, and r = −0.522, p < 0.001 for the SRK/T formula).