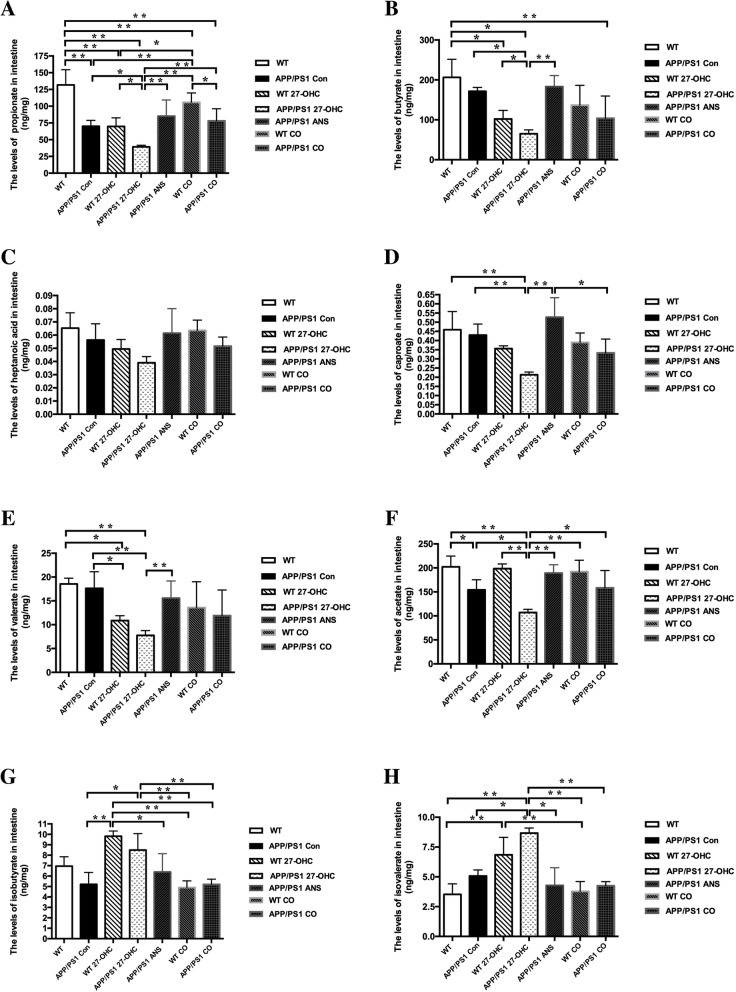
Fig. 14.
The fecal levels of propionate (a), butyrate (b), heptanoic acid (c), caproate (d), valerate (e), acetate (f), isobutyrate (g), and isovalerate (h) in different groups. Groups: WT: wild-type control group of C57BL/6J mice; APP/PS1 Con: transgenic control group of APP/PS1 mice; WT 27-OHC: C57BL/6J mice treated with 5.5 mg/kg 27-hydroxycholesterol; APP/PS1 27-OHC: APP/PS1 mice treated with 5.5 mg/kg 27-hydroxycholesterol; APP/PS1 ANS: APP/PS1 mice treated with 0.2 mg/day anastrozole; WT CO: C57BL/6J mice treated with 5.5 mg/kg 27-hydroxycholesterol plus 0.2 mg/day anastrozole; APP/PS1 CO: APP/PS1 mice treated with 5.5 mg/kg 27-hydroxycholesterol plus 0.2 mg/day anastrozole. One-way analysis of variance (ANOVA) was performed and post hoc comparisons were carried out using the LSD test. Asterisks indicate significant differences. Data are presented as mean ± SEM. *P < 0.05; **P < 0.01. n = 6/group

