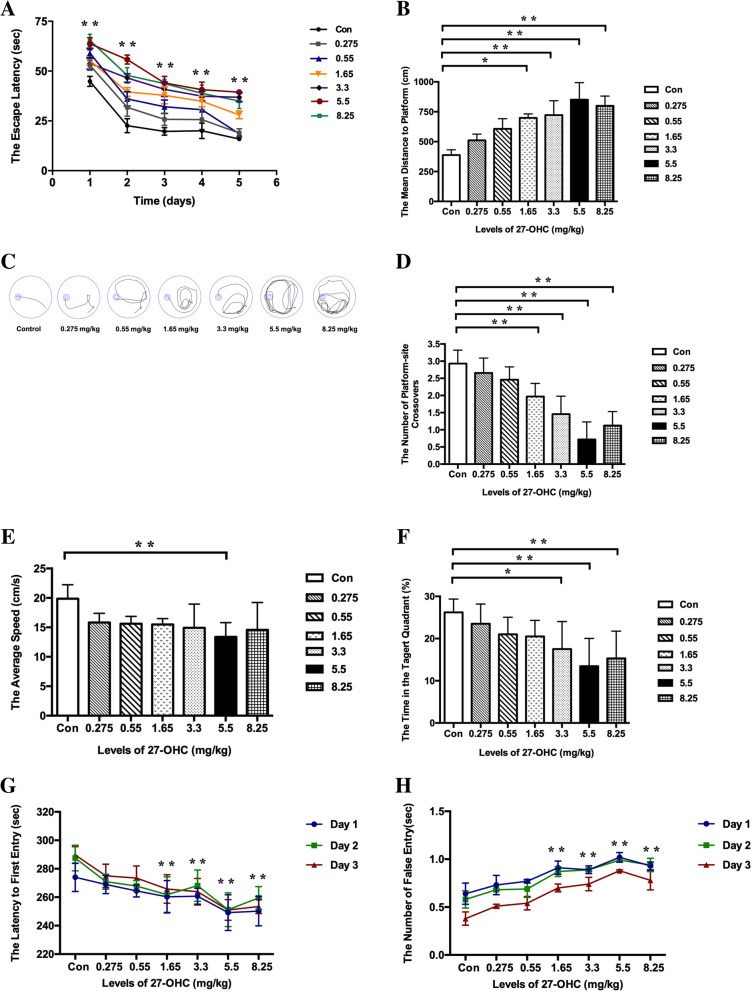
Fig. 4.
The escape latency (a), escape distance (b), and representative images of path (c) in orientation navigation test and the crossing-target number (d), swimming speed (e), and the target-quadrant abidance (f) in spatial probe test determined with the Morris water maze test as well as the latency to enter the dark area (g) and the frequency of entries to the dark area (h) determined with the passive avoidance test in C57BL/6J mice for different doses of 27-OHC treatment. One-way analysis of variance (ANOVA) was performed and post hoc comparisons were carried out using the LSD test. Asterisks indicate significant differences. Data are presented as mean ± SEM. n = 10/group. *P < 0.05; **P < 0.01

