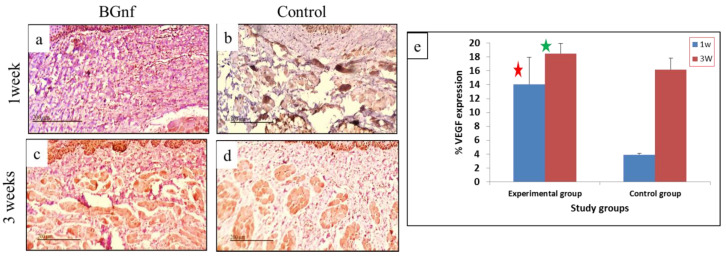
Figure 10.
Microscopic photographs and Graphical representation of the immunohistochemical expression of VEGF in BGnf treated and control mucosal wounds at one and three weeks’ time interval using DAPI. (a,c) Showing higher color intensity at the lamina propria of BGNF treated wound at (a) one week and (c) three weeks indicating high VEGF expression. (b,d) Showing VEGF expression in the control wounds at one week (b) and three weeks’ (d) time interval with observed lower intensity of brown coloration at the lamina propria layer indicating less VEGF expression compared to the experimental wound. (e) Graphical representation of the mean percentage of VEGF expression of the BGnf treated wounds and control wounds at one and three weeks’ time intervals, revealing significant higher intensity (p < 0.005) in VEGF expression (red and green star) of the BGnf treated wound at both time intervals when compared to that of the control wounds.

