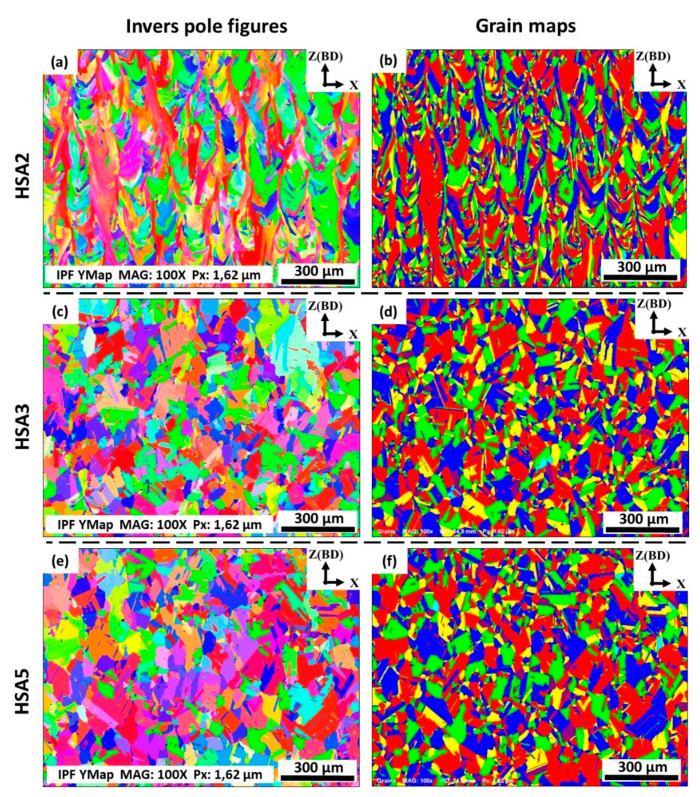
Figure 14.
The EBSD inverse pole figures (a,c,e) and grain maps (b,d,f) in the xz-plane of laser powder bed fused IN718 specimens in conditions: (a,b) HSA2; (c,d) HSA3 and (e,f) HSA5. For the IPF color legend, please refer to that presented in Figure 8. All the EBSD crystallographic orientation maps were plotted using the y-based projected IPF.

