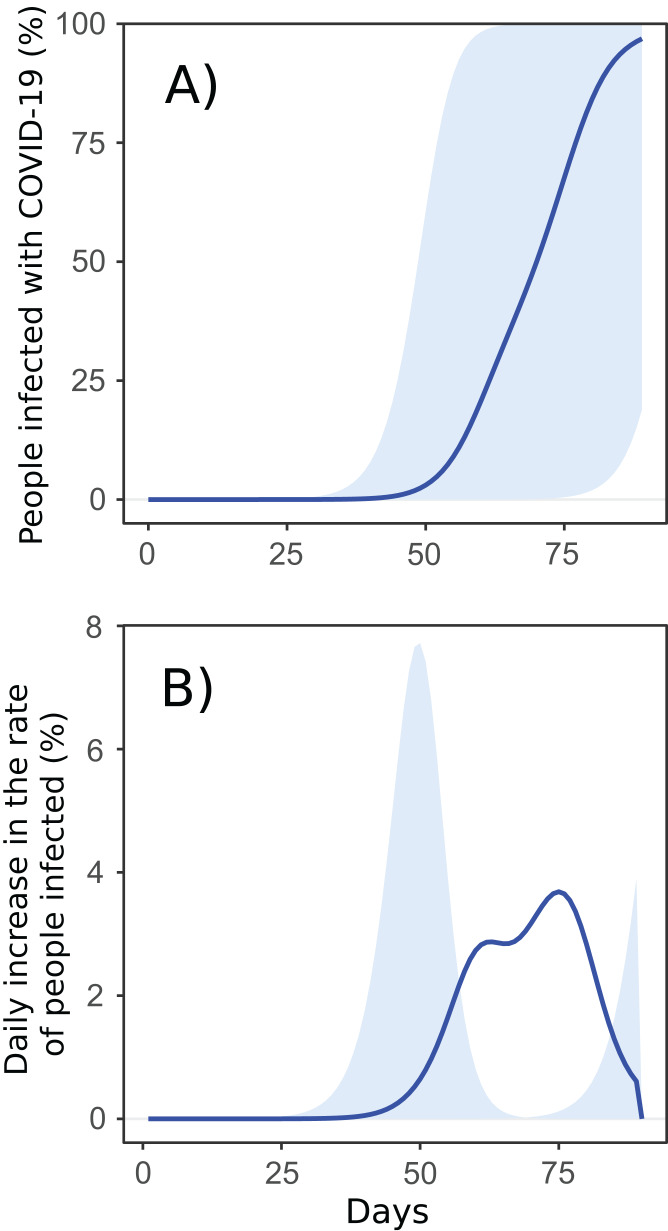
Figure 3. Proportion of infected people per cities until 90 days.
(A) Cumulative increment rate. The blue line is the national average, and the shadow area is the summing up of minimum and maximum values of all the cities per time interval; (B) daily increment rate. The blue line is the average, showing the overall high rate of infection occurring from 50 to 80 days. Shadow shows the first and the highest peak in the hub cities, around 50 days, and, subsequently, a peripheric peak after 75 days.

