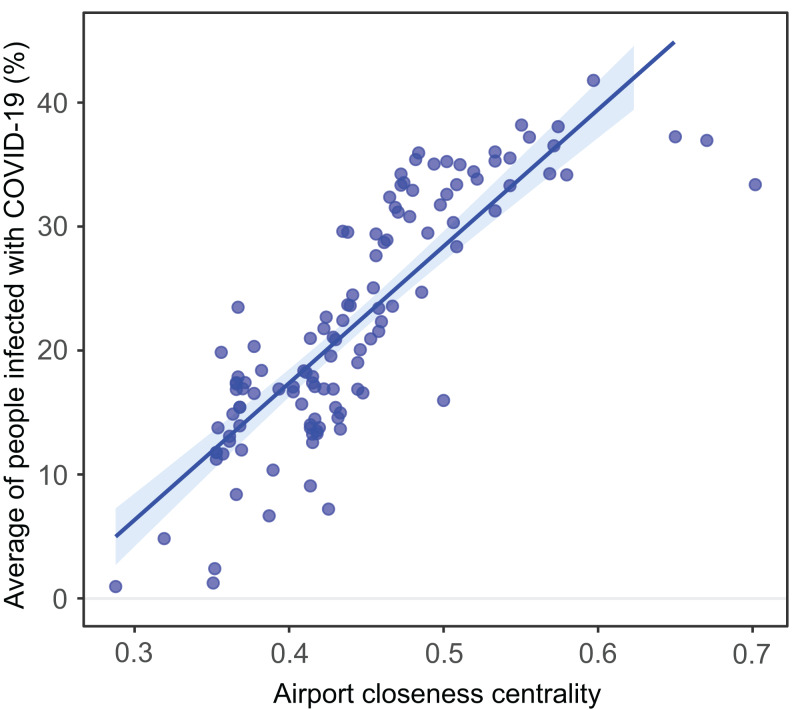
Figure 4. Airport closeness centrality within the Brazilian air transportation network, and its effect on the vulnerability of each city.
Correlation between airport closeness centrality within the Brazilian air transportation network, and its effect on the vulnerability of each city (represented by the average of the percentage of cases per city for the whole 90 days running: r2 = 0.71 p < 0.00001).

