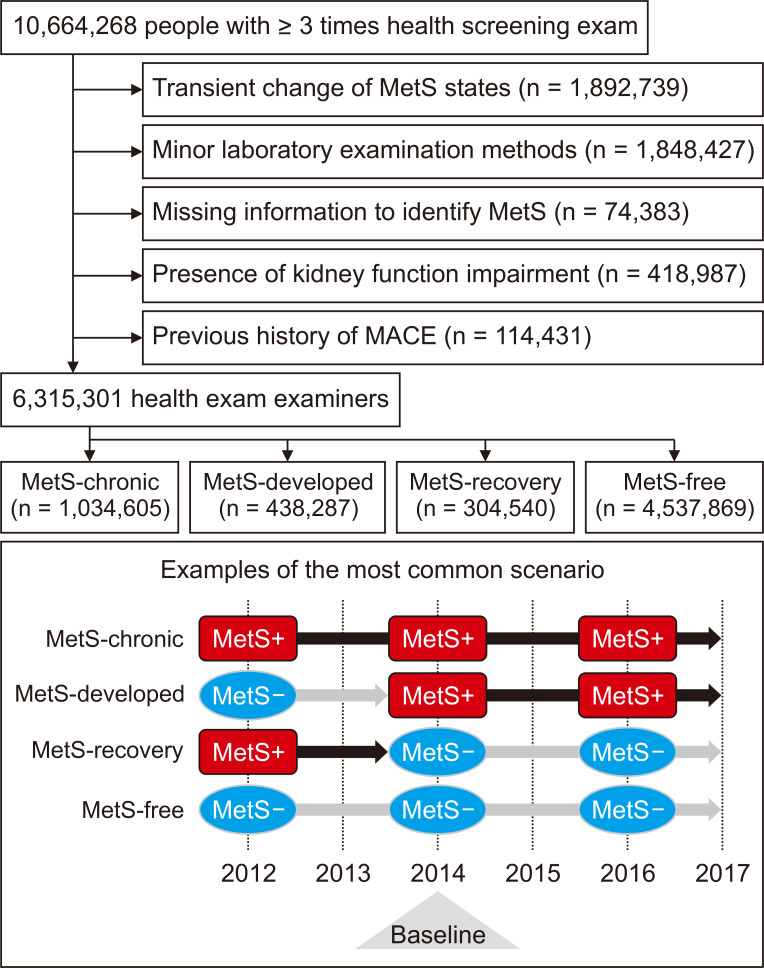
Figure 1. Study population criteria and representative scenarios.
The diagram shows the process of study population selection. Below is the most common scenario of the study groups among five national health examinations included in the study. The black squares (MetS+) indicate the MetS-present state, while the gray rounds (MetS-) indicate the MetS-absence state. The majority of the study subjects received three health examinations biennially. Therefore, the inclusion date (indicated with the triangle) was the second health examination for them. The detailed method to define each subgroup is described in the main text.
MACE, major adverse cardiovascular event; MetS, metabolic syndrome.

