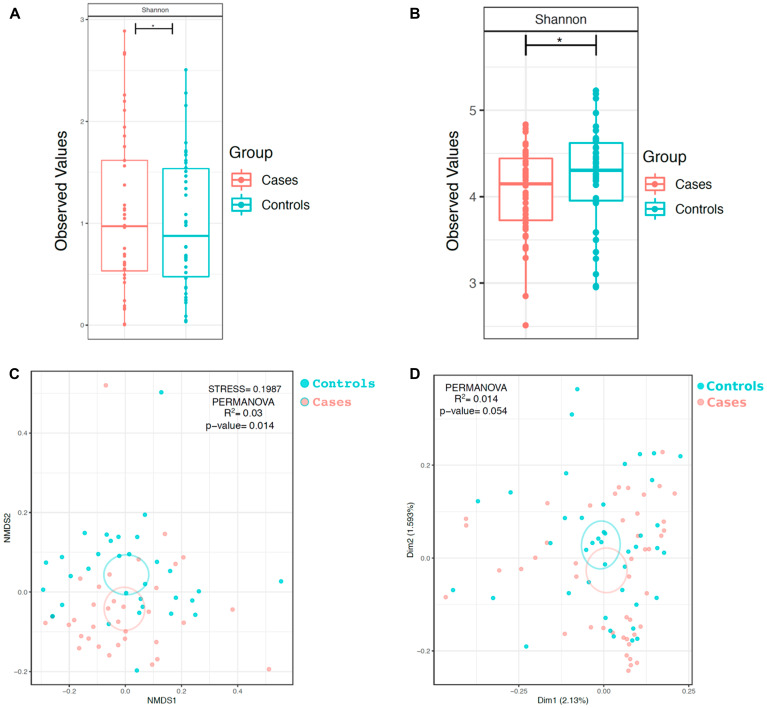
Figure 2. α and β-diversity of bacterial and fungal communities in HNSCC participant versus control participant oral wash.
α diversity of the (A) bacteriome and (B) mycobiome based on cancer status. β diversity of the (C) bacteriome and (D) mycobiome based on cancer status. * p <0.05, ** p < 0.01, *** p <0.001

