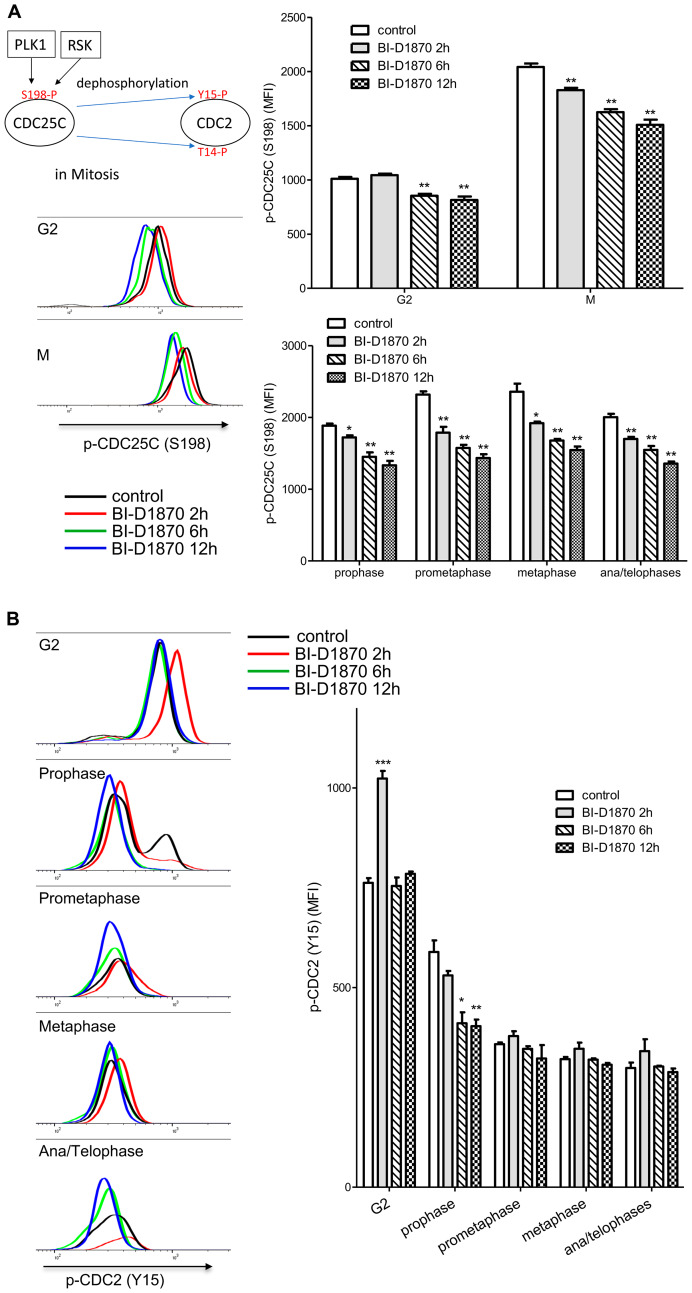
Figure 6. Effect of BI-D1870 on CDC2 and CDC25C activation.
HL60 cells were treated with BI-D1870 (5 μM) for the indicated hours, and then cells were collected and analyzed for the cellular levels of p-CDC25C (S198) (A) or p-CDC2 (Y15) (B). Fixed cells were stained with DAPI and antibodies against Cyclin A, Cyclin B, p-H3, p-CDC2 (Y15), and p-CDC25C (S198). (A) Decrease in positive phosphorylation at serine 198 (S198) on CDC25C following the treatment of BI-D1870. Representative plot of p-CDC25C (S198) levels in G2 and mitotic phases populations following the treatment of BI-D1870. The graph shows the MFI of p-CDC25C (S198) in G2 and mitotic phases populations of HL60 cells treated with or without BI-D1870. (B) Temporary inhibition of CDC2 activation in the G2 phase by BI-D1870 treatment. CDC2 activity is regulated in a negative fashion by phosphorylation at tyrosine 15 (Y15). Representative flow cytometric profile of p-CDC2 (Y15) levels in the G2 and mitotic phases populations following the treatment of BI-D1870. The graph shows median fluorescence intensities (MFI) of p-CDC2 (Y15) in the G2 and mitotic phases populations of HL60 cells treated with or without BI-D1870. Negative phosphorylation at Y15 on CDC2 was transiently enhanced in only the G2 phase at 2 h after BI-D1870 treatment. Flow cytometric profiles represent one out of three independent experiments. Values are graphed as mean ± SEM (n = 3). * p < 0.05; ** p < 0.01.

