
Fig. 1.
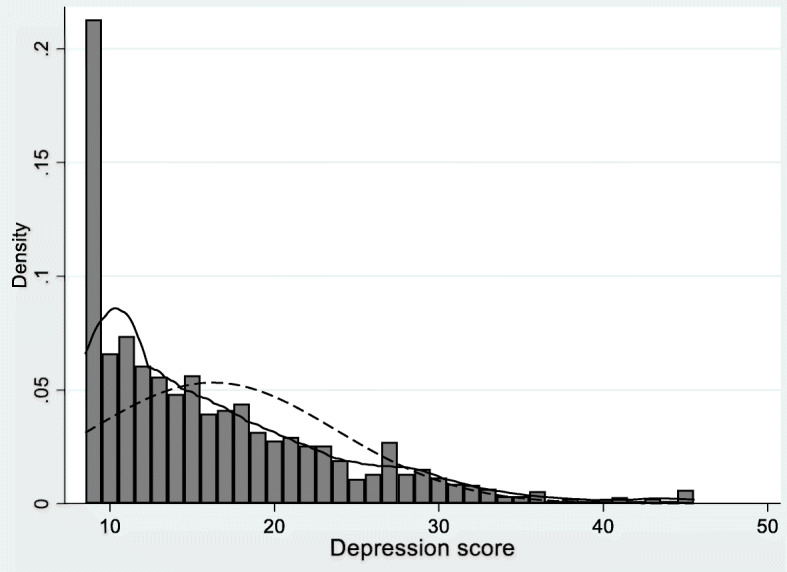
Histogram of depressive symptoms, overlaid with kernel density (solid) and normal density (dashed) plots
Official websites use .gov
A
.gov website belongs to an official
government organization in the United States.
Secure .gov websites use HTTPS
A lock (
) or https:// means you've safely
connected to the .gov website. Share sensitive
information only on official, secure websites.
Histogram of depressive symptoms, overlaid with kernel density (solid) and normal density (dashed) plots